The Quick Stats give you an overview of your site’s performance, and you can find them at the top of every report.
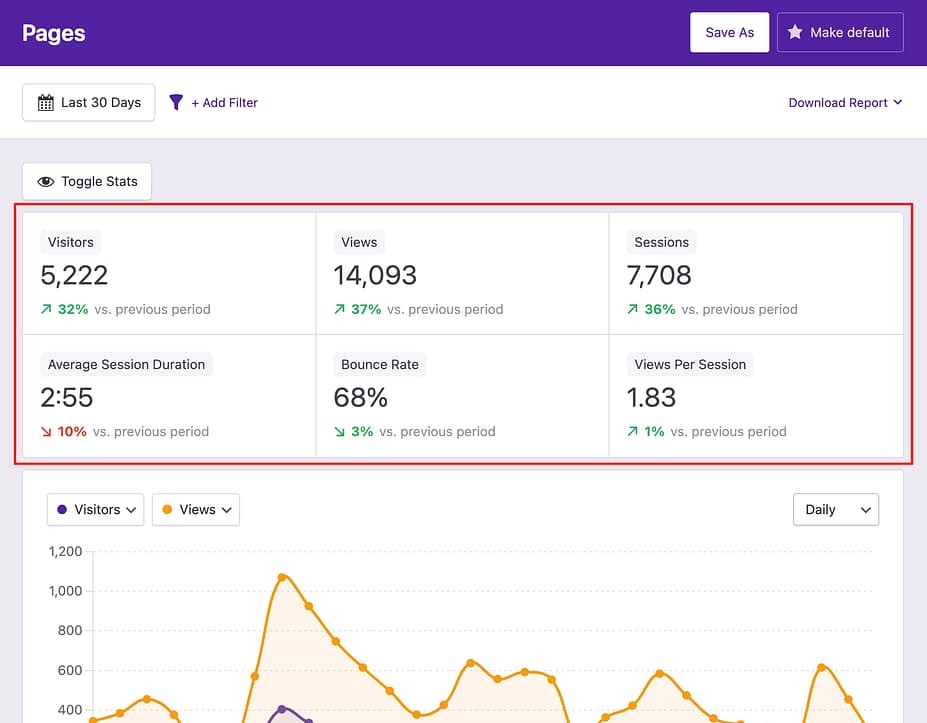
By default, the Quick Stats display the following metrics:
For each stat, there is a percentage, which is the relative growth of the stat compared to the previous period. For instance, if you had 1,000 Visitors in the last 30 days and the percentage is positive 10%, that means your site got 10% more visitors than the preceding 30 days.
When you first install Independent Analytics, there won’t be any data old enough to make a comparison, so the percentage will default to 0%.
Toggling the Quick Stats
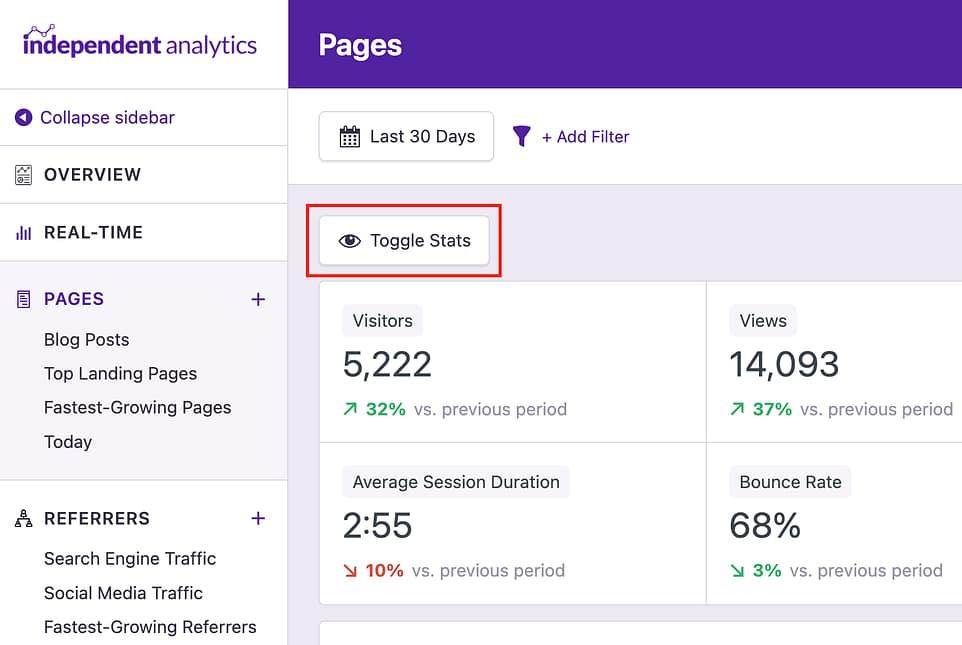
If you’d like to change which stats are visible, you can click on the Toggle Stats button above the Quick Stats.
In the modal, there is a checkbox for each of the stats. You can use these to hide/show whichever stats you’d like.
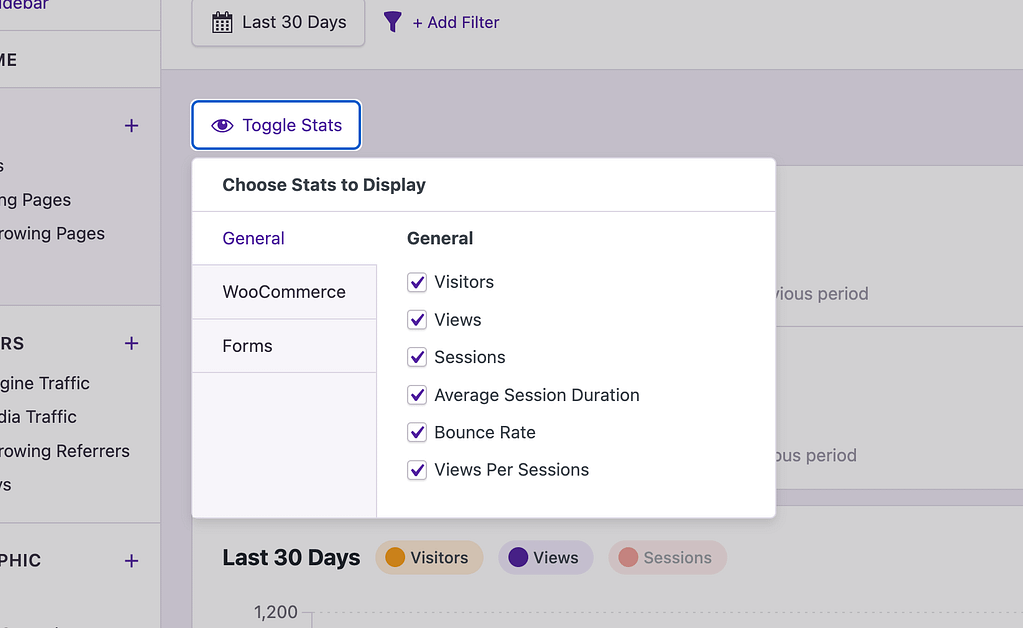
If you save the report, your selections here will also be saved.
For Independent Analytics Pro users, there are also sections for eCommerce and Forms. In these sections, you can enable various eCommerce stats or form stats, like submissions and conversion rates. You can learn more about these stats in the eCommerce guide and form tracking guide.
If you add a filter to the report, you’ll notice that the Quick Stats show two numbers each.
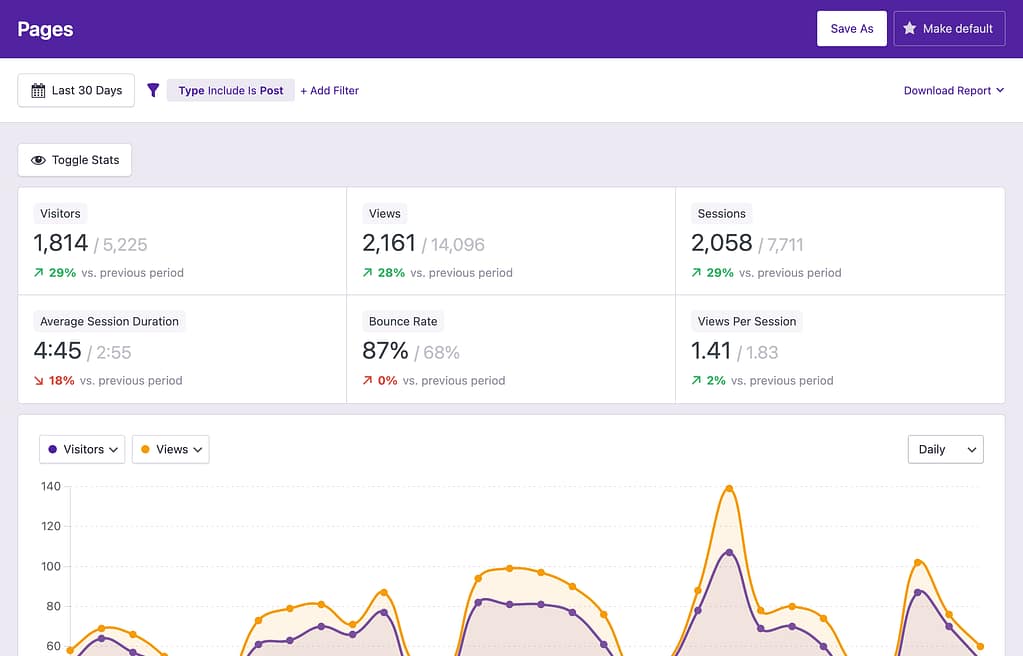
The first number is for the filtered result. For instance, in the screenshot above, it’s showing that Post pages have gotten 1,814 visitors and 2,161 views in the last 30 days.
The lighter gray number after the forward slash is the unfiltered value. In this case, you’re seeing that the site as a whole has had 5,225 visitors and 14,096 visitors in the last 30 days.
