The Devices report will show you the device types, browsers, and OSes used by your visitors.
To access the Devices report, start by clicking the Devices menu item.
In this report, you’ll find the familiar Quick Stats featured in all the other reports, followed by the chart and data table.
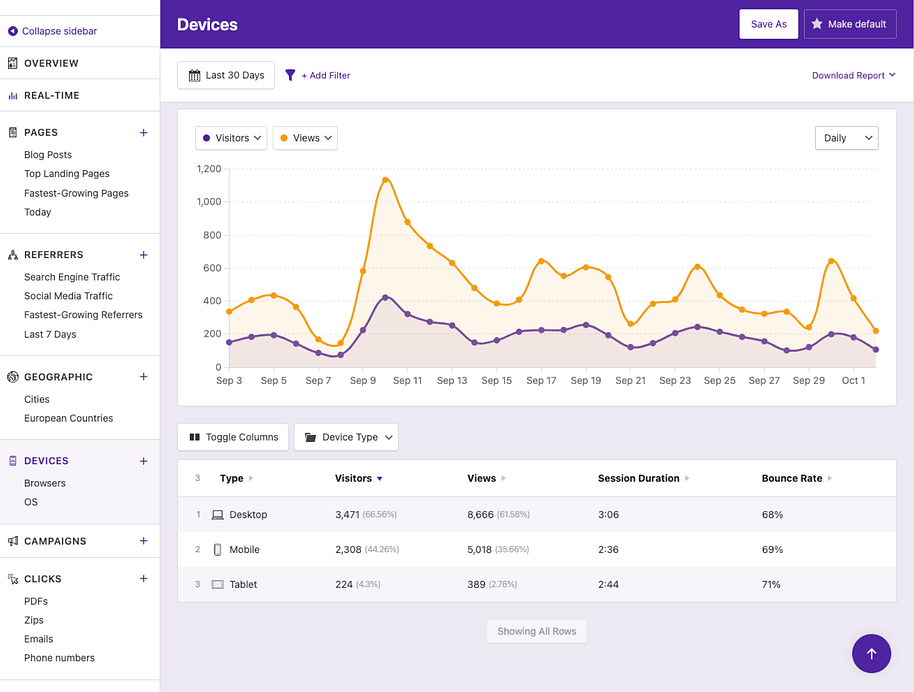
In the data table, you’ll see a list of the device types used to access your website, including metrics like the number of views and visitors.
The main device types are desktop, mobile, and tablet, but there is also support for recognizing visitors using wearables, smart TVs, gaming consoles, and even cars.
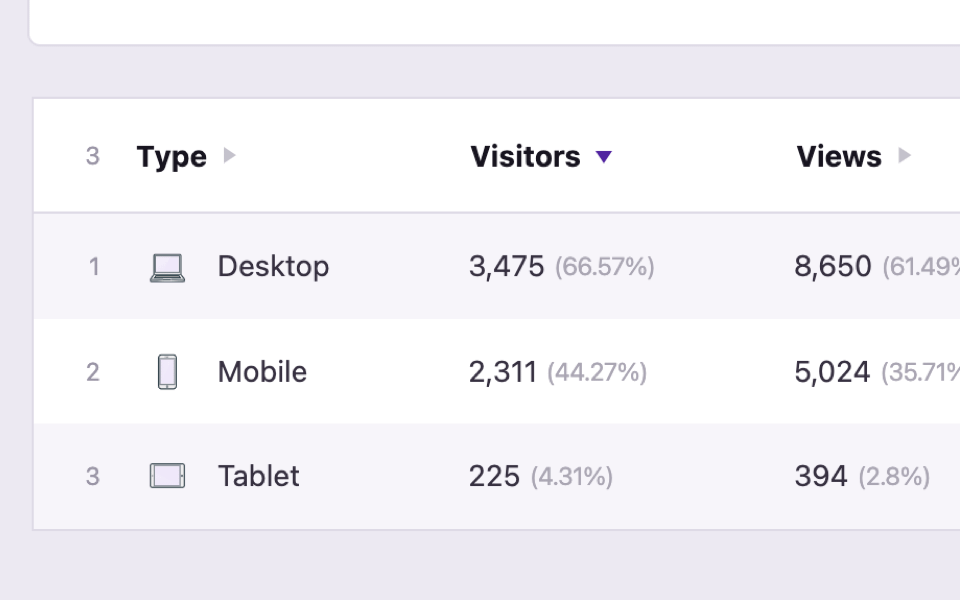
Notice the percentages in parentheses, which tell you the traffic share of each device type. The screenshot above shows us that 66.57% of visitors are using a desktop device.
You can also compare metrics like session duration and bounce rate to see if any device type performs better than the others (not pictured above).
Browser & OS data
The Device report can also show you data for browsers and OSes.
In the toolbar, click the Group by Device Type button, and you’ll see other ways to display the report.

If you select Browser and click Apply, the data table will update to display metrics for browsers instead of device types.
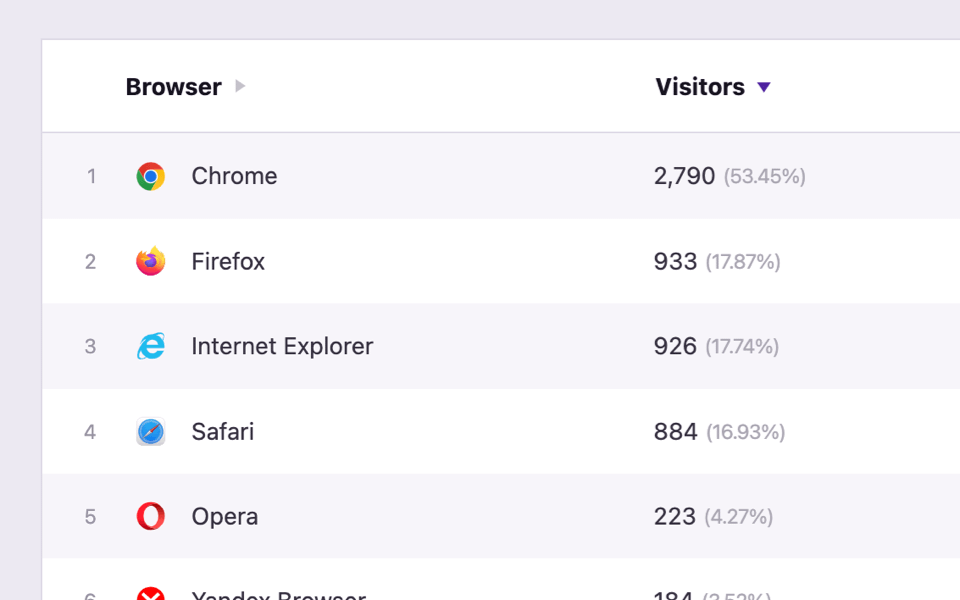
This works the same way when grouping by OS.
What device types are included?
Independent Analytics recognizes the following seven device types:
- Mobile
- Tablet
- Desktop
- Wearable (e.g. Apple Watch)
- TV
- Console (e.g. Xbox)
- Car
For most sites, nearly 100% of visitors will be using one of the first three device types, but we’ve included support for a wide array of devices to capture as much data as possible.
