Find Data From All Your Reports in One Place
- Choose from 10 unique modules
- See data from every report in one place
- Drag-and-drop modules into position
- New vs. returning sessions
- Busiest time of day & week
- Recent views & conversions
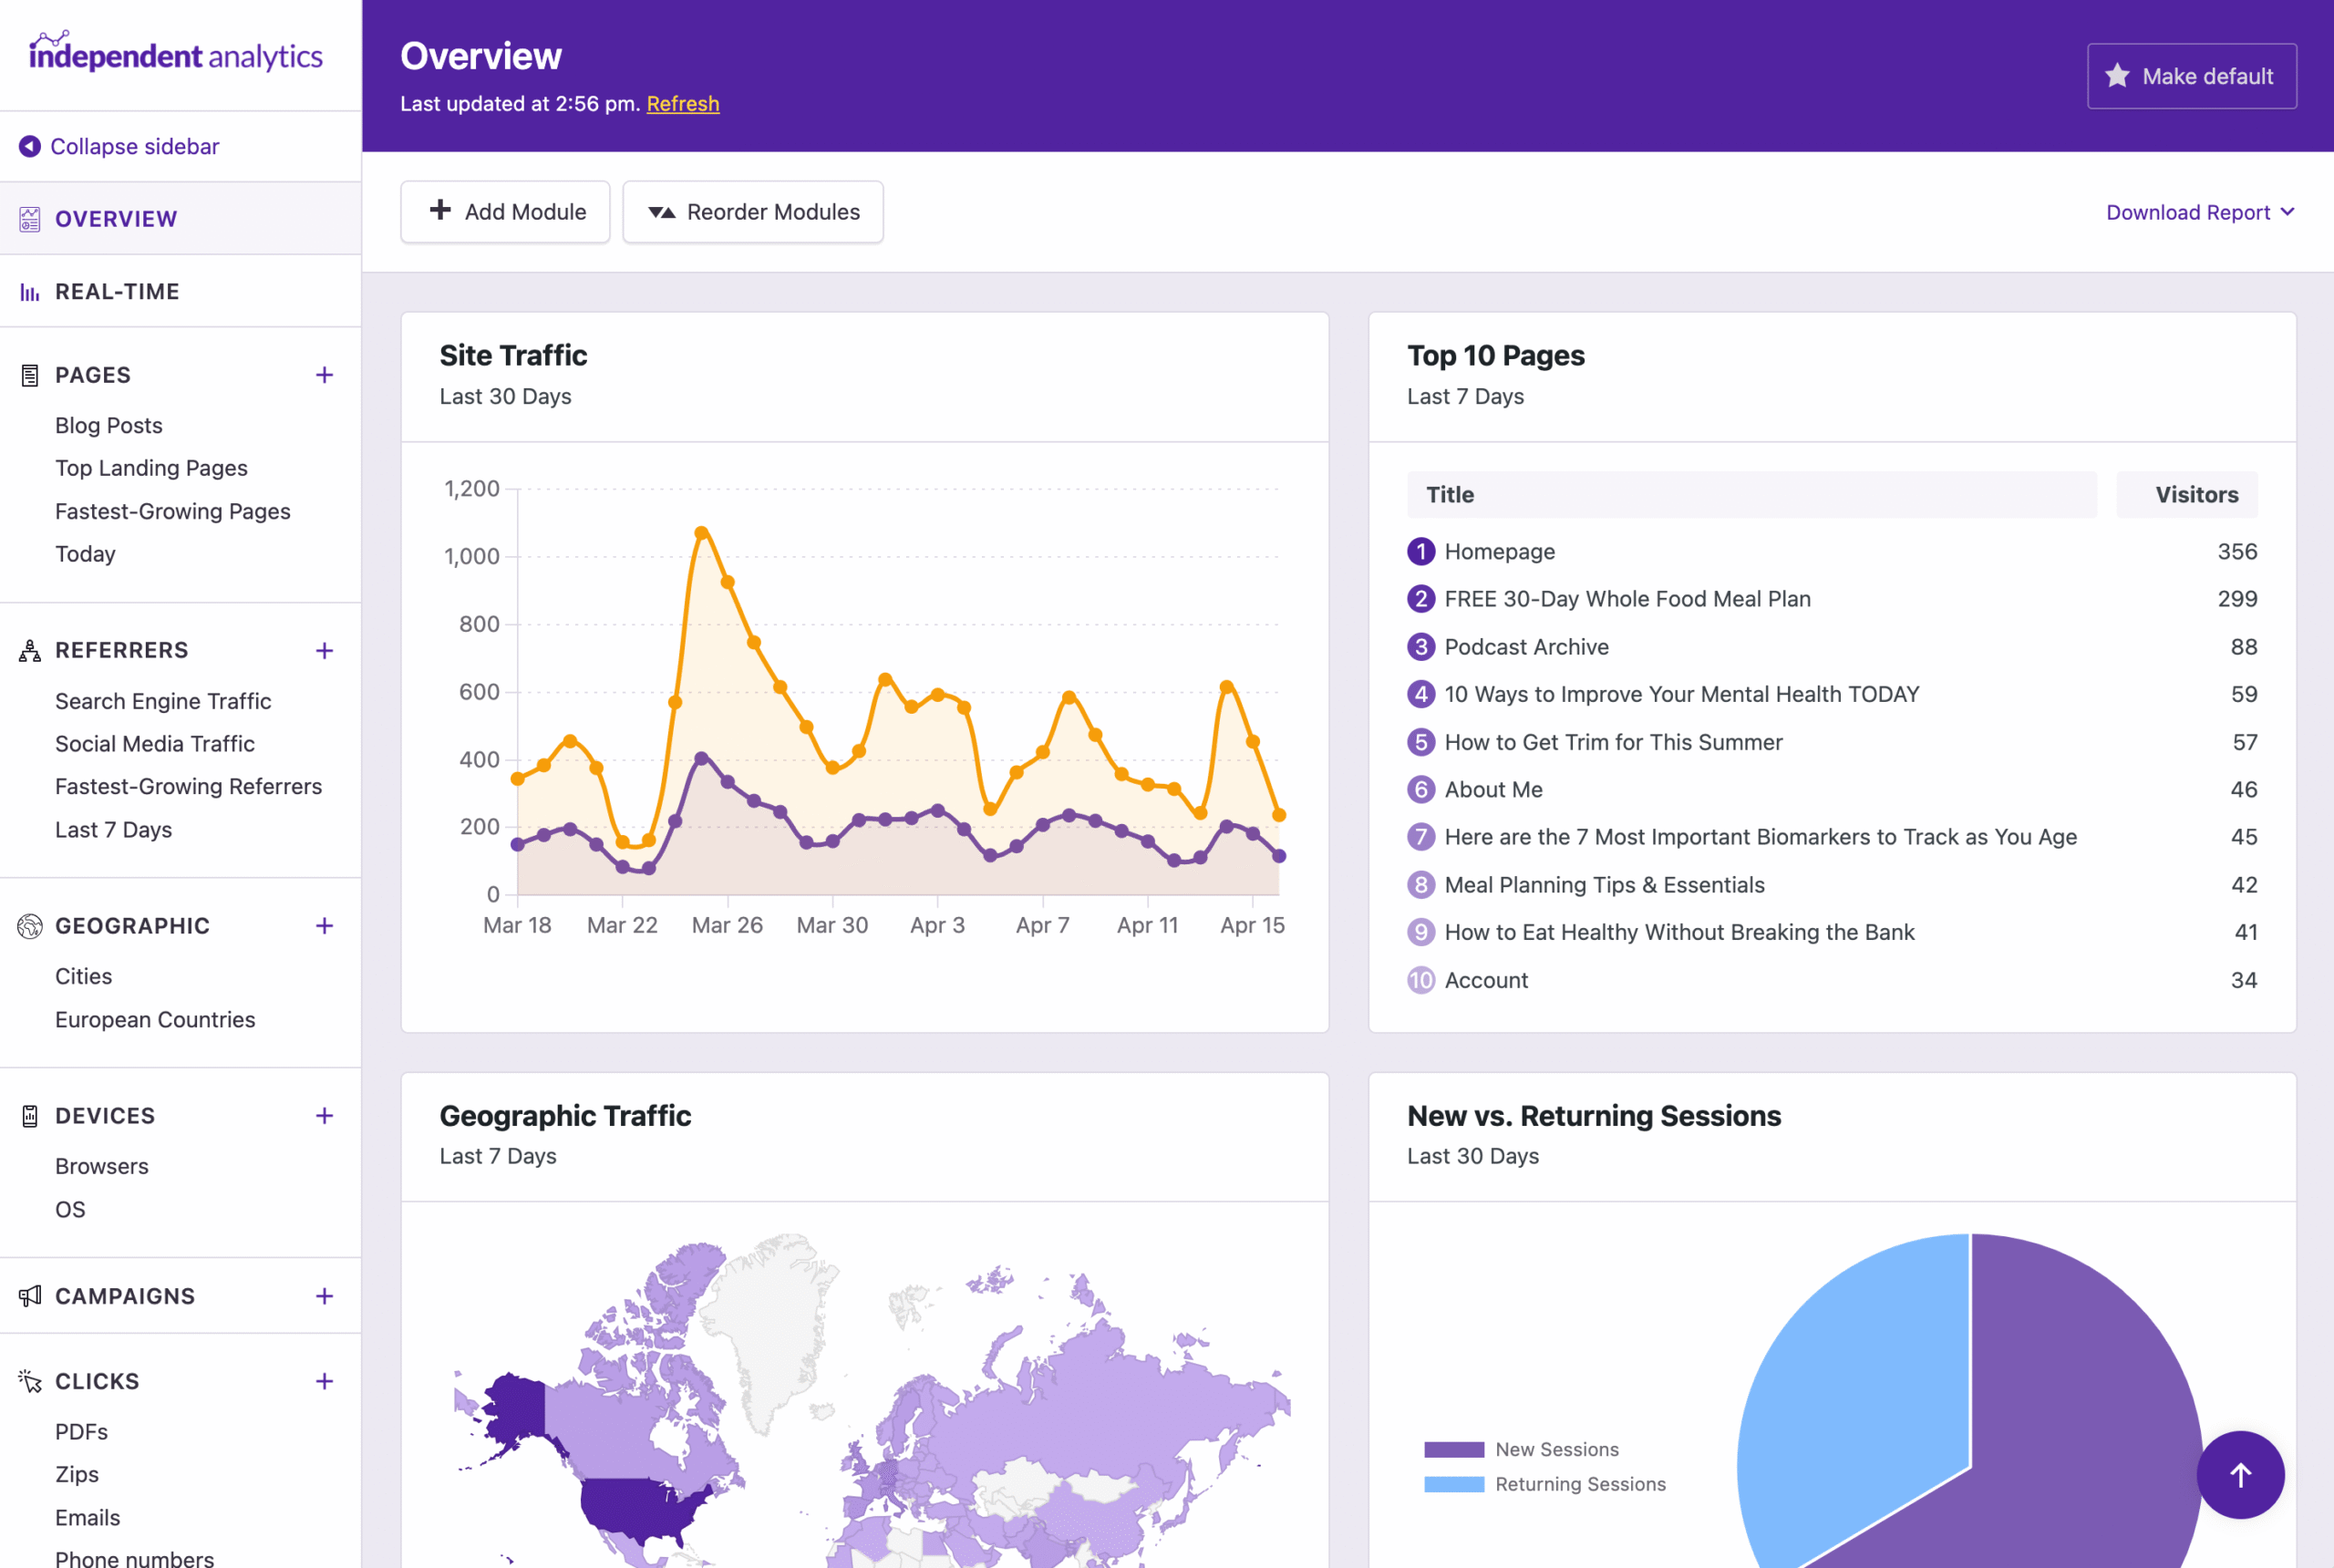
Display data from each of your reports in the custom Overview. You can add as many modules as you want to create the perfect dashboard for your website.
You can choose from 10 different modules when creating your Overview report. Add as many as you need to create the perfect display for understanding the performance of your website.
The modules are highly customizable, allowing you to display whatever data you need. You can set a custom title, choose a report, decide how to sort the results, and more.
Use the simple drag-and-drop system to reorder the modules. You can switch between the normal display and drag-and-drop mode with a single click.
The New vs. Returning Sessions module shows you exactly how much of your traffic is from new visitors versus returning visitors.
The Recent Views module shows you the last 40 pages viewed on your site, including the country, device, and browser of the visitor.
The Recent Conversions module displays the last 40 conversions that took place, including eCommerce sales, form submissions, and/or clicks.
The Busiest Time of Day and Busiest Day of Week modules give you a comprehensive look at when your site gets the most traffic.
Yes, you can add as many copies of each module as you’d like.
The Overview report refreshes once every hour. If you’d like to view data that is more recent, you can click the “Refresh” link to update the modules with data from the present moment.