Independent Analytics includes a Geographic menu that shows which countries and cities your visitors are from.
You can reach this dashboard via the Geographic report link in the sidebar.
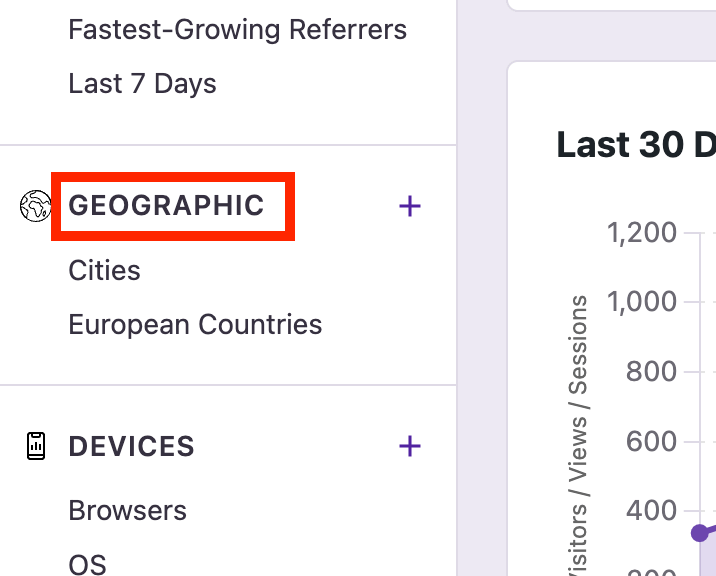
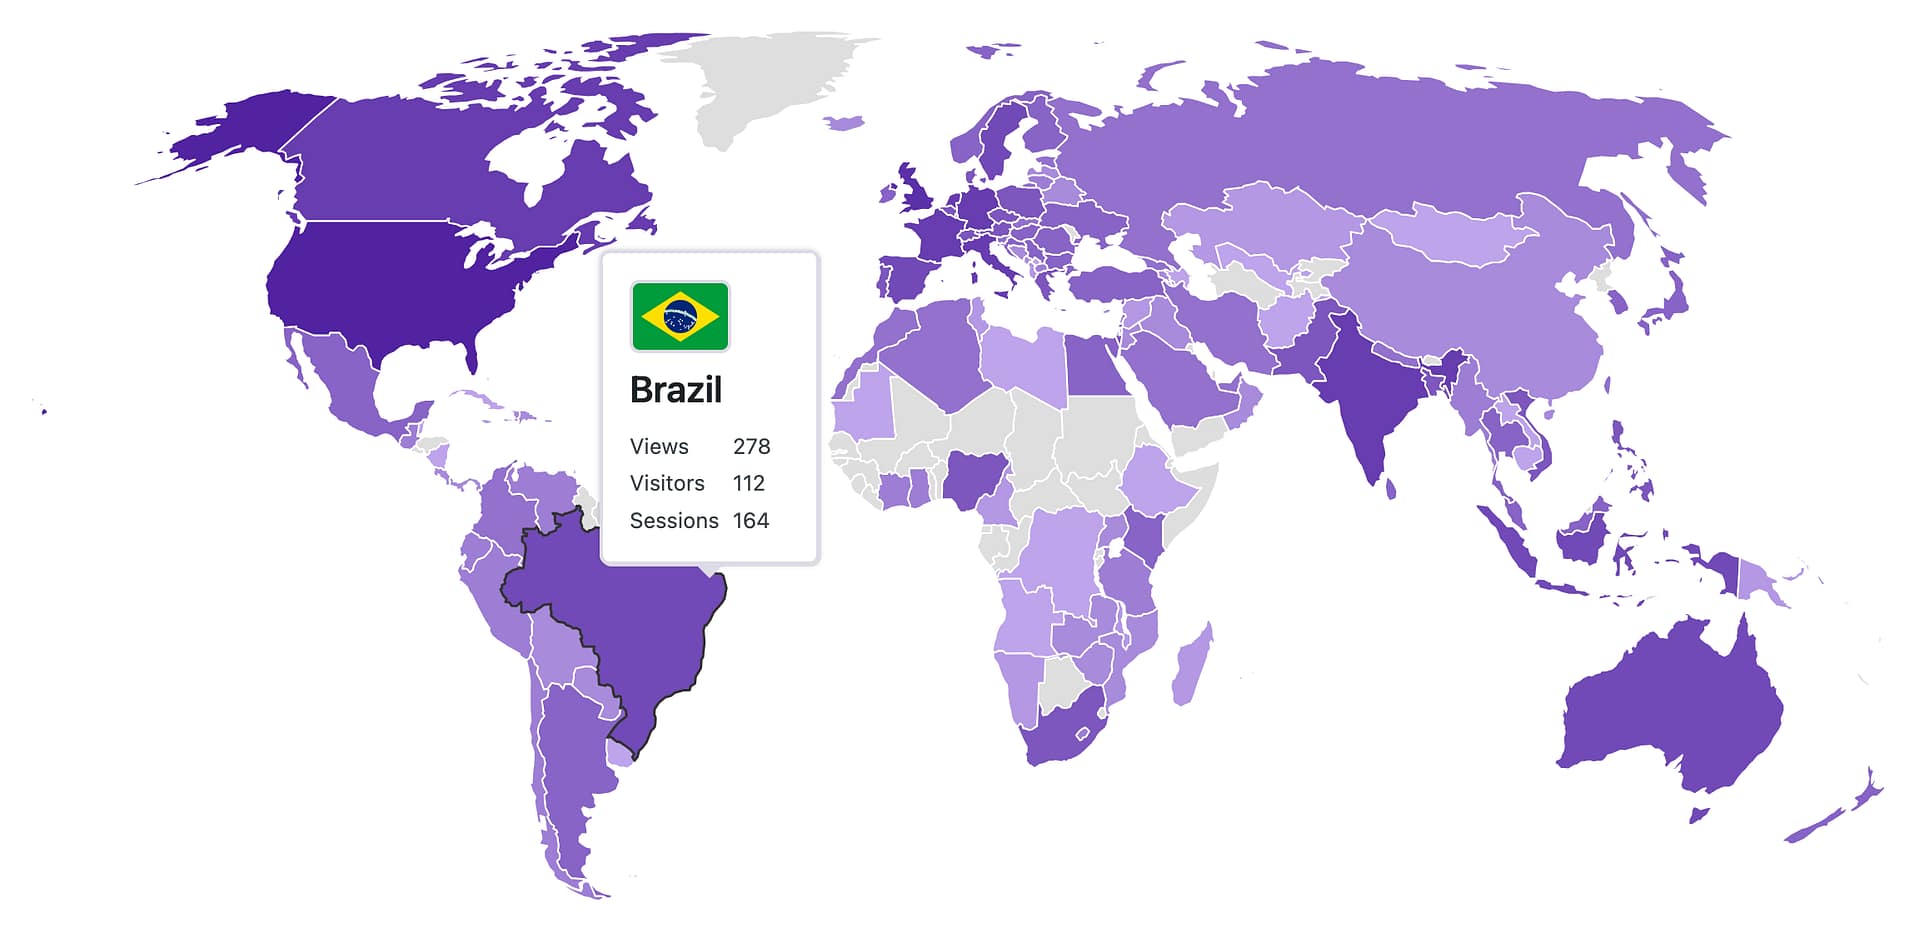
In place of the regular chart, you’ll find a world map. It’s color-coded so that countries with more visitors are a darker shade of purple. You can hover your cursor over any country to see the number of visitors, views, and sessions.
How to use the data table
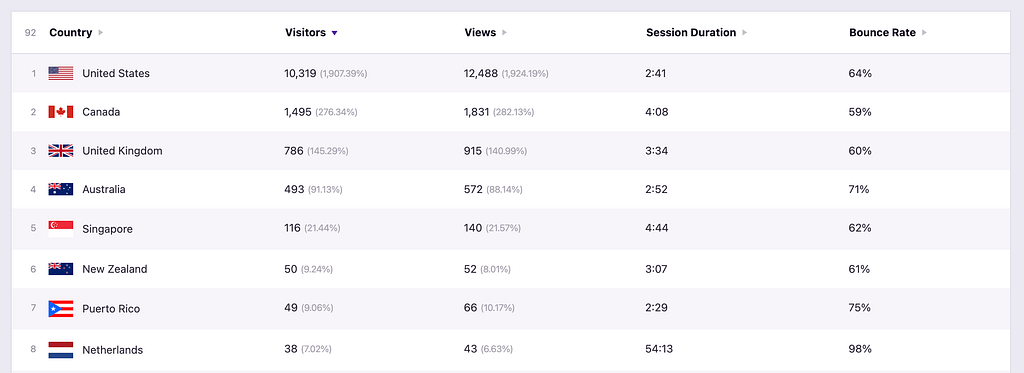
Like other dashboards, the Geographic report also includes a data table with a row for every unique location.
By default, the table groups data by country, so you can see a list of every country that sent you a visitor.
If you want to see city-level data, you can do so by changing the grouping:
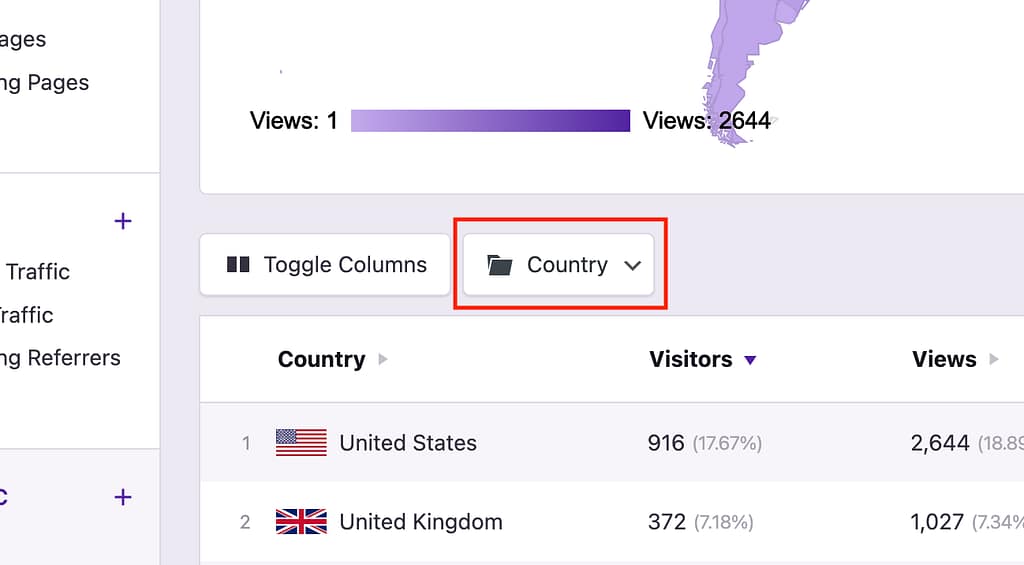
This will update the table to list every city that sent you a visitor, including the subdivision/state it’s in.
There’s also a Continent column that’s hidden by default. You can display it by customizing the columns.
This gives you a clear picture of where all your site’s visitors are coming from. And if you want to dig deeper, you can apply a filter.
How to filter geo data
Every city gets its own row in the data table, which gives you a comprehensive look at where your visitors are coming from.
However, you may want to view the cities from just one country, subdivision, or continent. To find this information, you can use a filter.
Start by clicking the Filter Rows button in the toolbar. Next, select an operand, like Country or City, and then type in the name of the location you want to filter by.

In my example, I’ve filtered the table so that only cities in Spain are displayed. With this filter applied, the Quick Stats, chart, and data table will all update to match the filtered data.
Additional conditions can be applied, and you can learn more about that in our complete filters tutorial.
What is a subdivision?
“Subdivision” is a catch-all term used to describe a region that comes between a city and a country. For instance, Philadelphia is in the state of Pennsylvania in the USA, so Pennsylvania is used as the subdivision.
These subdivisions are called different things in different countries, but they are simply referred to as subdivisions in the Geographic report.
How accurate is this data
The geolocation data is more than accurate enough to give you a sense of where your visitors are from, but the data is not perfect. You can read a thorough explanation of why that’s the case here:
