The filtering system is an invaluable tool for digging deeper into your data.
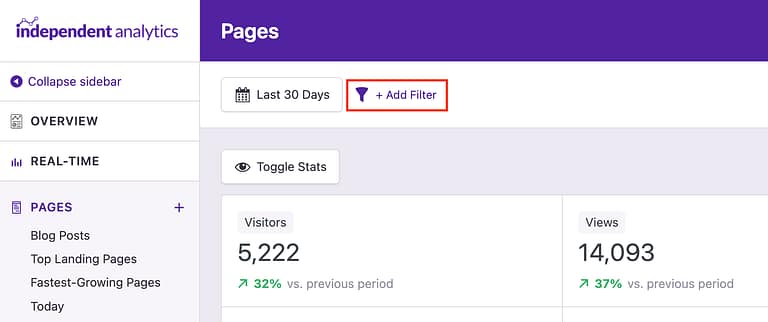
To filter your data, start by clicking the Add Filter button.
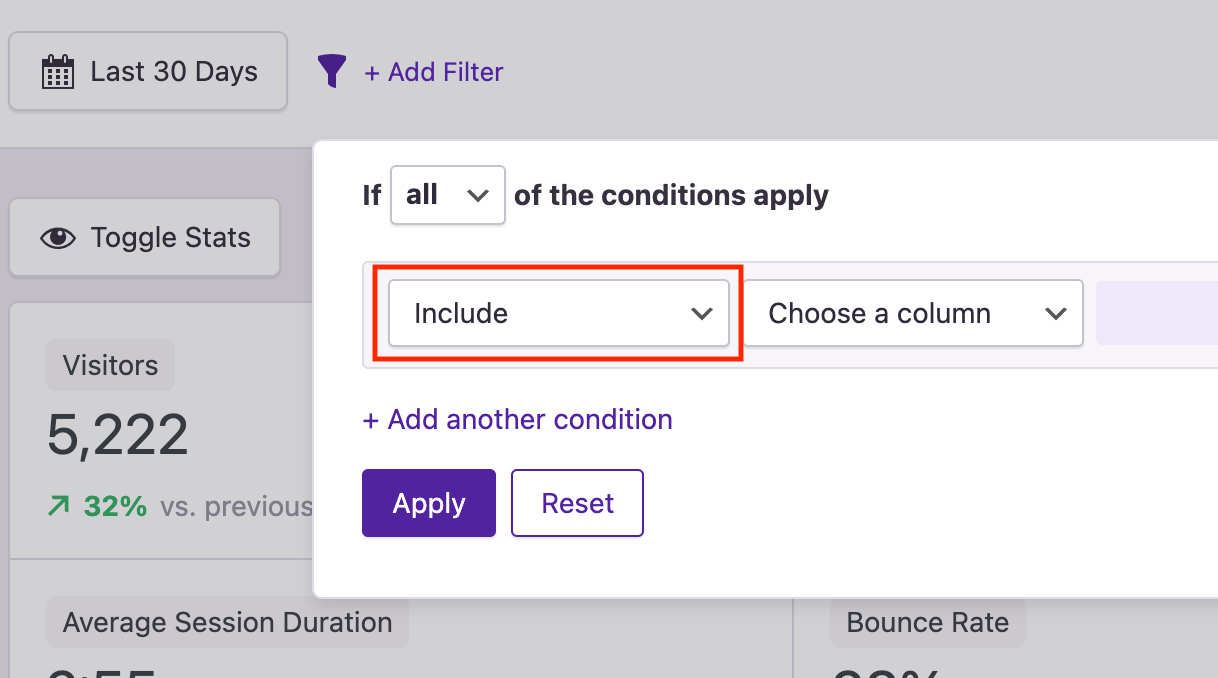
This will open a modal that looks like this:
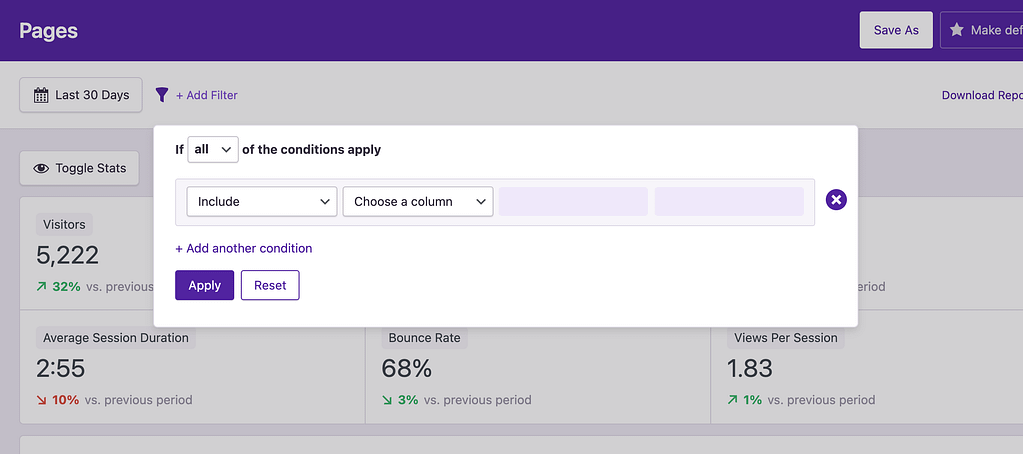
In the modal, you’ll see an option to Choose a column. These columns correspond to the same ones available in the data table below. To continue, select the column you want to filter the report by.
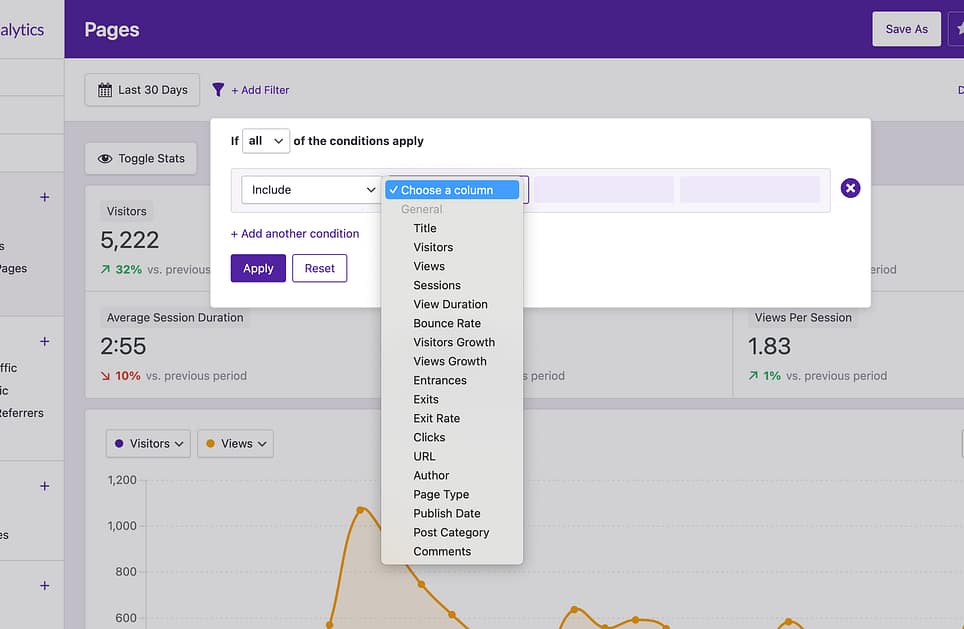
Once you’ve selected a column, you can choose an operator and an operand.
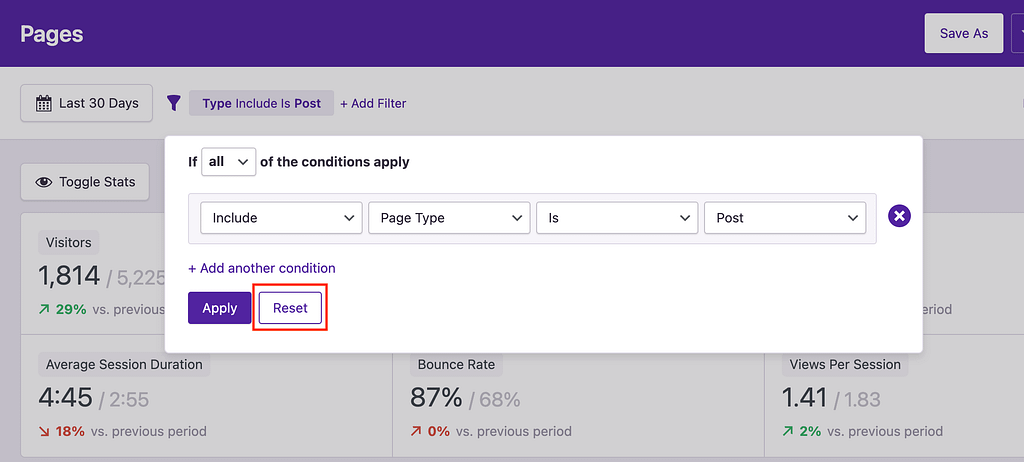
For example, let’s say you want to filter the Pages report so that it only shows stats for your blog posts. You would choose the Page Type column, then select the Is operator and the Post operand.
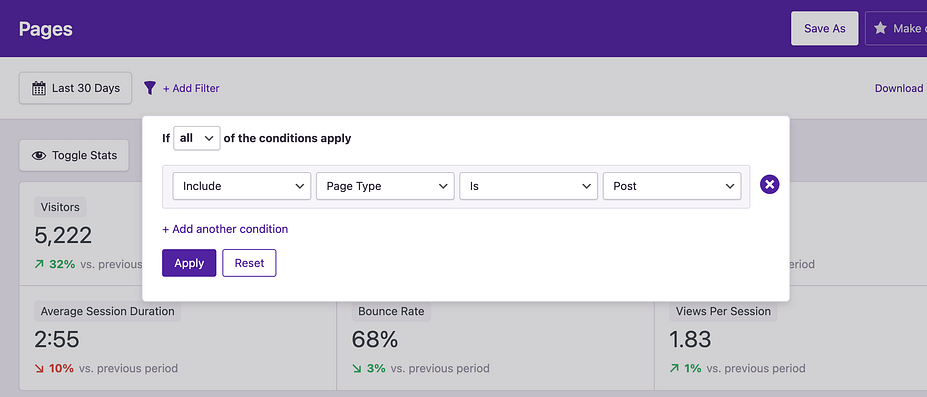
On the left side of the form, there is also an option to include or exclude pages that match your criteria. By default, it’s set to Include, but you could flip it to Exclude if you wanted to see the stats for all pages that aren’t blog posts.
Once you’re happy with your changes, you can click the Apply button. The Quick Stats, chart, and data table will update to reflect the new filters.
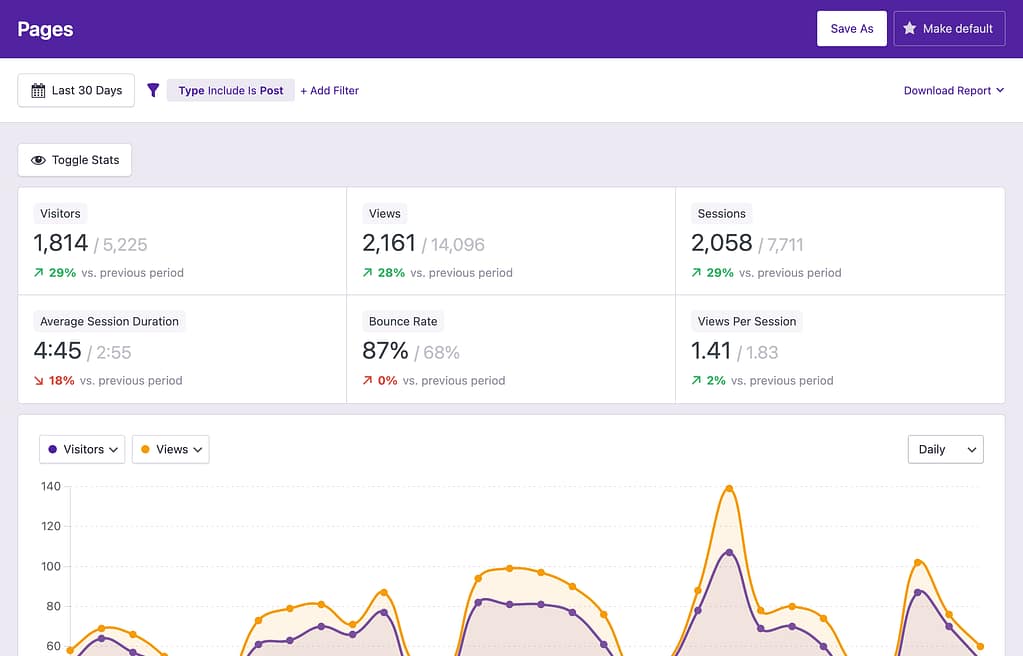
In the toolbar, you’ll see a label for the filter you have applied. You’ll also notice that the stats each show two values. The first is the filtered value, and the second is the unfiltered value. For example, you can see that the blog posts on the site have had 1,814 visitors, whereas the site as a whole has had 5,225 visitors.
Using multiple conditions
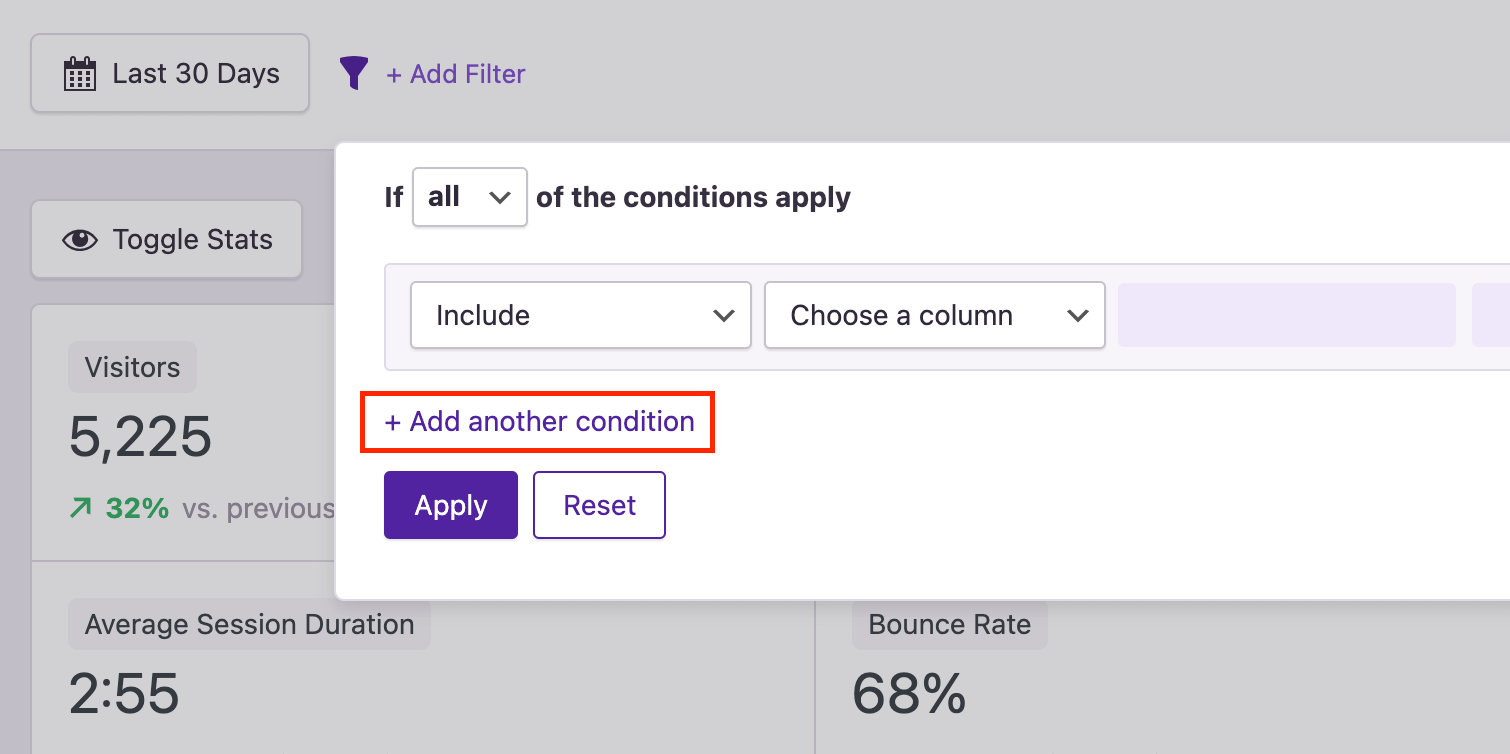
The previous example included one condition that required all rows to belong to Posts. You can add more conditions to your filter by clicking the Add another condition button.
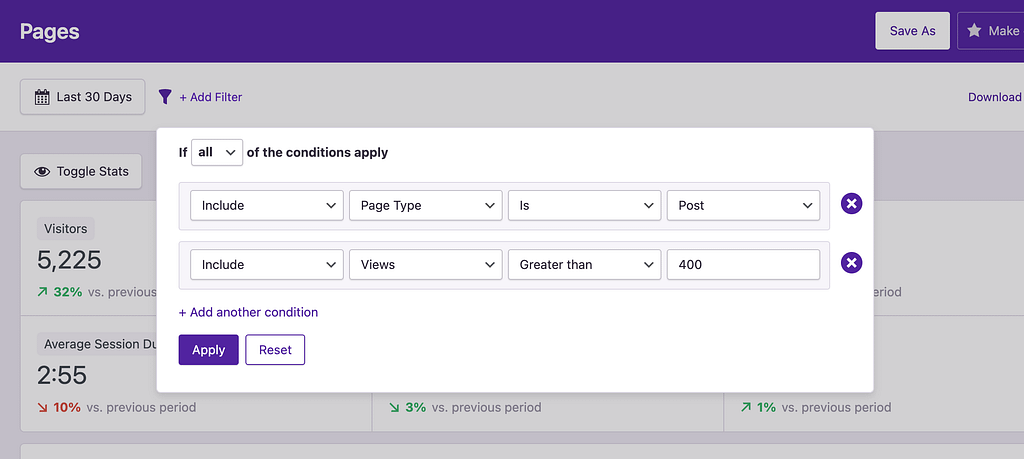
By default, all of the conditions will be required. For example, if you add a filter saying that the page type is “post” and the number of views has to be greater than 400, then only posts with more than 400 views will be included.
However, if you want to include pages that meet either of these conditions, you can switch the option at the top of the modal to any.
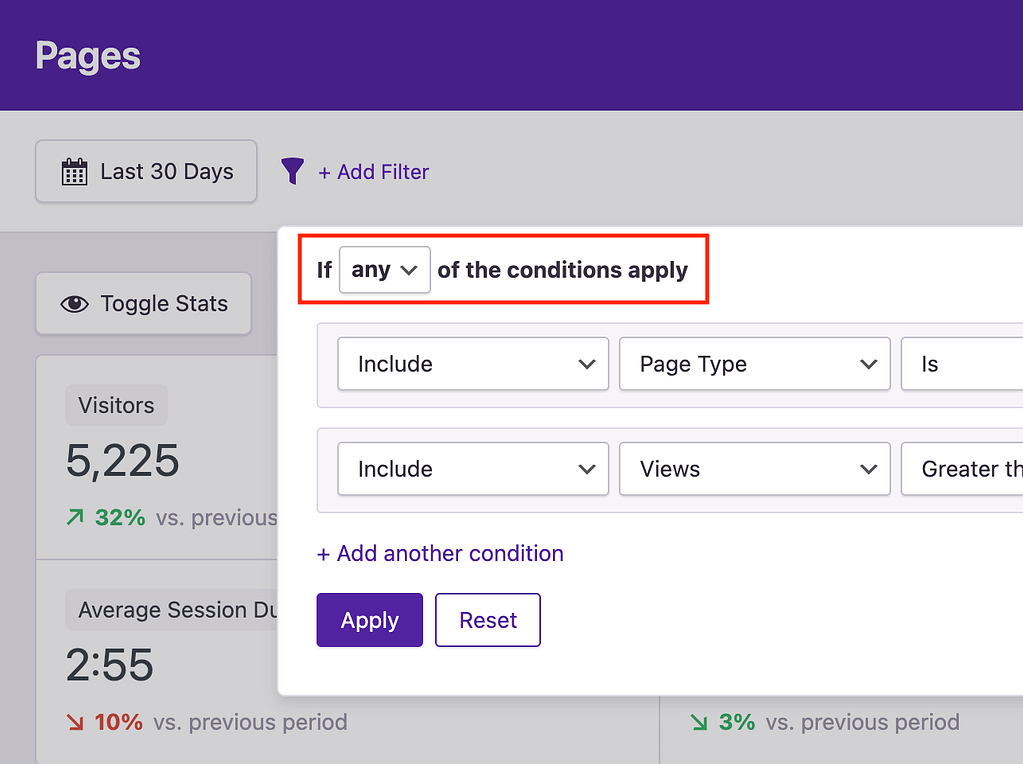
Now, a page only has to match one of these conditions to be included. This can be useful in many ways, such as creating a report for a handful of pages matched by their title or URL.
Using the filters, you can create entirely custom reports that help you better understand your website and its visitors. If you create a report that you find especially useful, remember to save it so you can revisit it easily in the future.
And remember, the filters are available in every report, so you can use them to look at specific referrers, locations, and devices too.
Resetting the filter
If you want to undo the changes added by a filter, you can open it and click the Reset button at the bottom.
If you’ve added multiple conditions and only want to remove one, you can click the delete button found to the right of the condition.
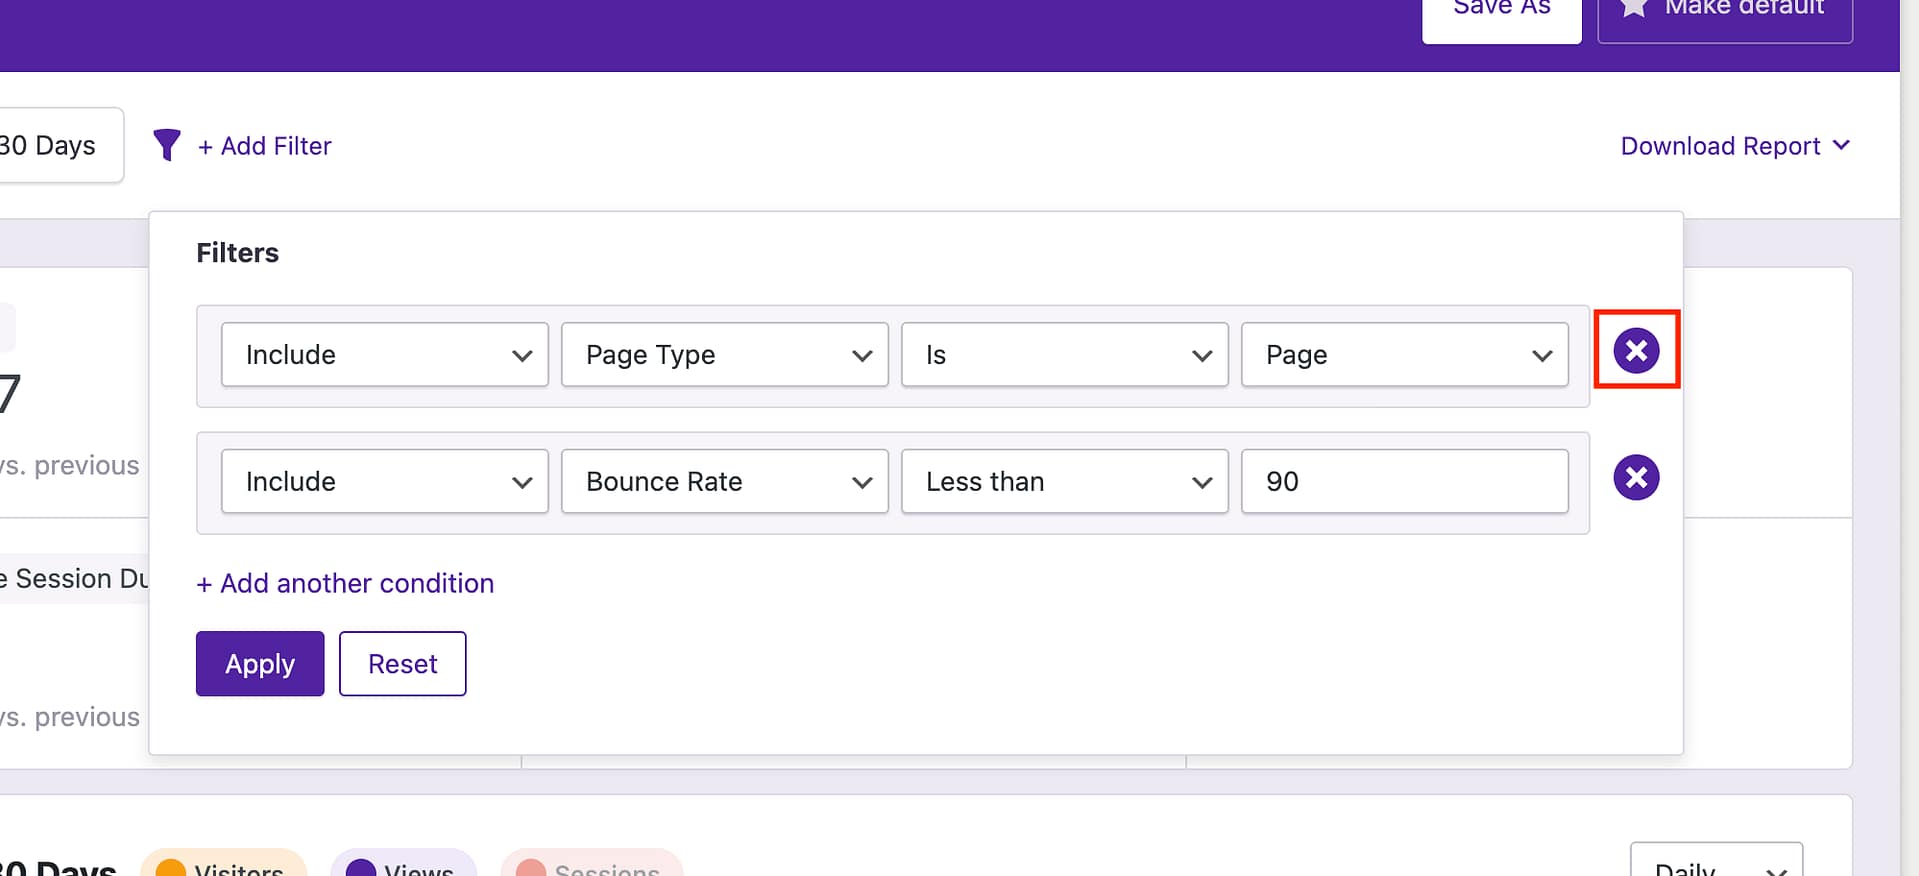
If the condition has already been applied, the dashboard will refresh automatically to match your new filter settings.
