Each report includes a variety of data columns, but one of the most powerful is the Visitors Growth column.
You can enable it in any report by clicking the Edit Columns button and then checking the Visitors Growth box.

Once enabled, the next step is to click on the Visitors Growth table heading to sort the table.
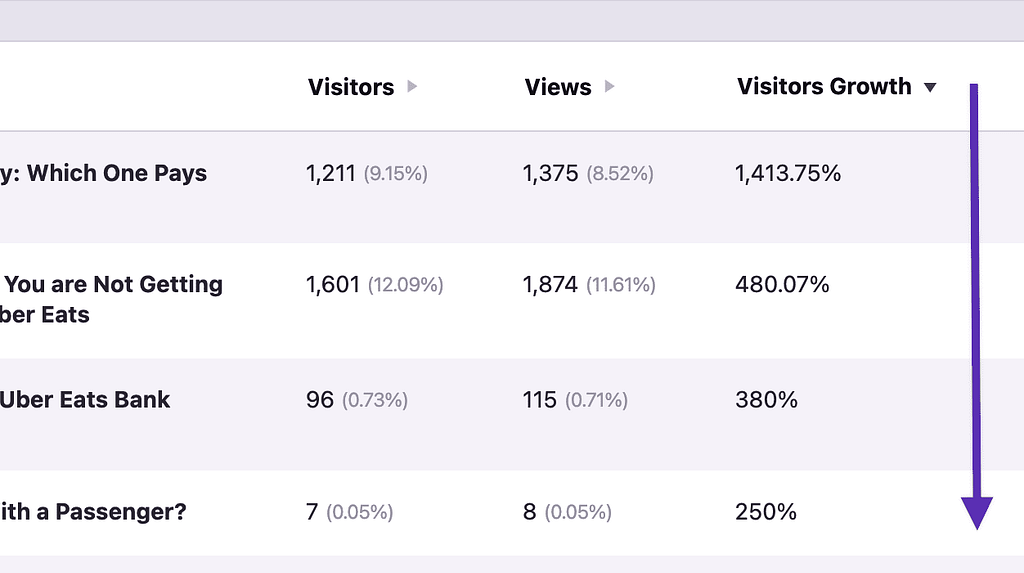
Right away, you’ll see the pages that have grown the most. While already useful, you will want to clean things up a bit.
For starters, a page that has grown by 100% isn’t really exciting when it got 2 visitors last month and 4 visitors this month.
That’s why you’ll want to add a filter to set a minimum number of visitors. Click on the filter button in the toolbar, select the Visitors column, choose Greater than as the comparison, and then enter the minimum number of visitors you want to consider.
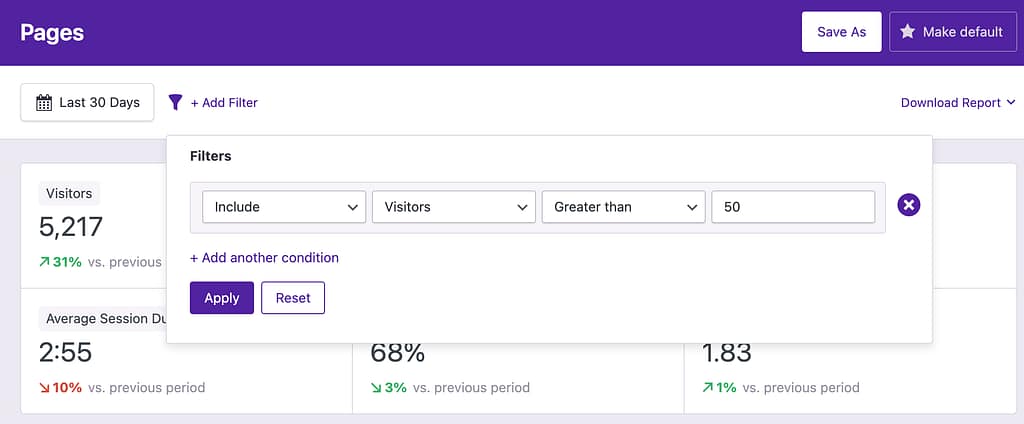
This will remove any pages that have grown by a lot but have a negligible amount of traffic. You’ll be left with a list of pages with substantial traffic, sorted by those that have grown the most.
It’s just as useful to reverse-sort this list and see which pages have lost the most traffic. You might find pages you need to promote more or articles that need to be re-optimized for SEO.
Expanding the date range you’re viewing is also a good idea. A post that has lost 10% of its traffic doesn’t look so bad until you find out it’s lost 10% every month this year.
We only looked at the Pages report in this tutorial, but the steps are exactly the same for the Referrers, Geographic, Devices, and Campaigns reports. For example, you can repeat this process to find your fastest-growing traffic sources or countries where you’re newly popular.
