
Thanks so much for subscribing to access this members-only guide!
In the tutorial below, you’ll find 46 different tactics to boost the profitability of your website. These steps are broken up into three distinct sections:
- Growing your eCommerce sales
- Getting more email subscribers
- Boosting your affiliate commissions
Depending on the nature of your website, you may find value in one or all three sections below. Regardless, we hope this guide brings a flood of new revenues to your business!
Growing your eCommerce sales
The first 19 tactics will help you increase your eCommerce sales by optimizing your landing pages, referrers, campaigns, and more.
1. Drive more traffic to your most profitable landing pages
In the Pages report, sales are attributed to landing pages. For example, if someone clicks on one of your blog posts in a Google search results page and then they end up buying something, the blog post will get credit for the order in the Pages report.
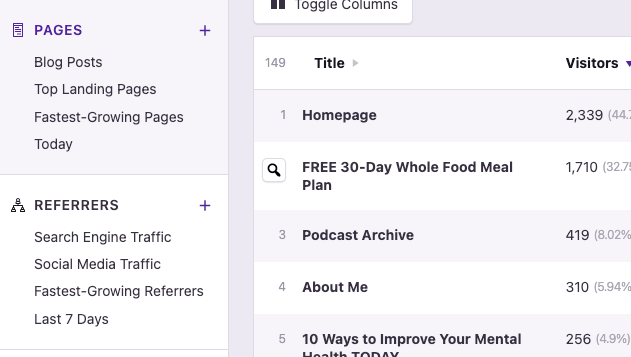
To find your top landing pages, enable the Orders and Gross Sales columns, and then sort the pages by either one.
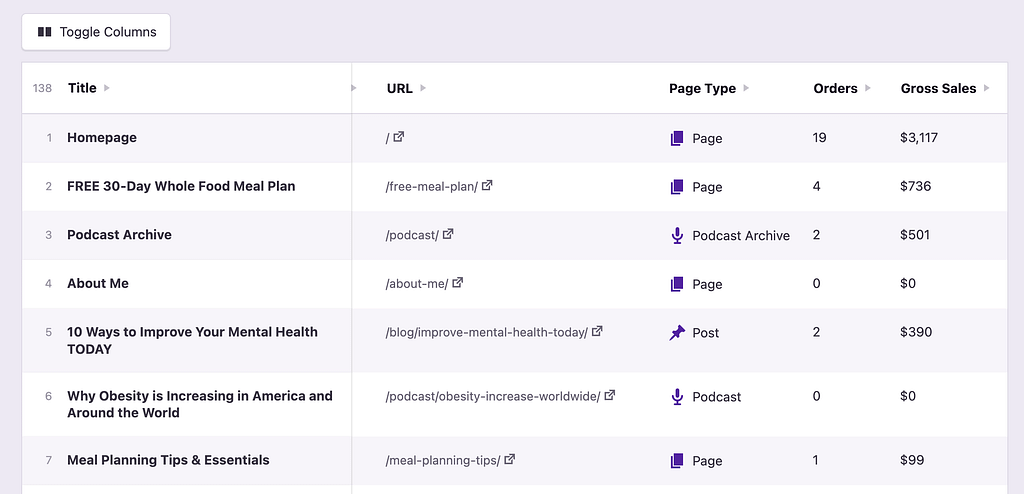
Driving more traffic to these pages will help you increase your sales. That could mean building more backlinks to help them rank higher, or sharing them more frequently across your social channels.
eCommerce tracking in Independent Analytics Pro is currently integrated with WooCommerce, FluentCart, SureCart, Easy Digital Downloads, and Paid Memberships Pro.
2. Publish more pages like your top performers
Once you’ve exhausted all your techniques for driving more traffic to your top landing pages, the next step is to try and replicate them.
What do your winning landing pages have in common? Do they share a similar format or topic? Try to publish more pages like them to further boost your sales.
If you have lots of blog posts driving sales, it could help to enable the Post Category column to see if there are specific topics that are attracting more buyers.
3. Send more traffic to your highest-converting landing pages
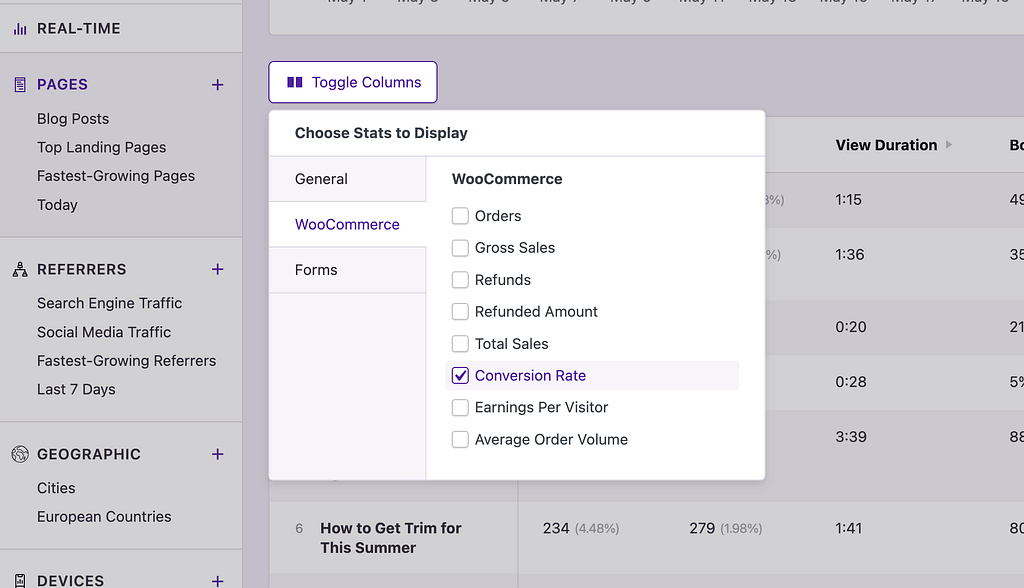
Another way to gauge performance is by looking at conversion rates instead of total sales. Use the Toggle Columns button to enable the Conversion Rate column and then sort your pages by this metric.
Depending on your results, you might have a few pages with just one order and an extremely high conversion rate. You can add a filter to remove these results from the page:

Now you’ve got some great data on your hands. Look for pages that have an unusually high conversion rate but don’t get many visitors. These might be your best opportunities to get a positive ROI from your marketing. Try sending more visitors to these pages to boost your sales.
4. Re-optimize your under-performing landing pages
With your pages sorted by conversion rate and filtered by those with more than one order, you can click the Conversion Rate table heading to reverse-sort the list.
You’ll find pages with zero orders and thus, a 0% conversion rate at the top of the list. Add a filter to only include pages with a Conversion Rate greater than 0 to clean up the list.

Now you’ve got a list of landing pages that are converting poorly. Look for any pages that you expected to perform better than they are.
Try re-optimizing these pages by:
- Adding new content
- Update the format/design of the page
- Replacing the recommended product
If any of these pages are receiving a significant number of visitors, then an optimization that improves the conversion rate can have a serious impact on your sales.
5. Deprioritize failing landing pages
If you can’t find a good way to improve a low-converting landing page, it’s time to decide if it’s helping or harming the business.
You could stop marketing these pages if you are putting any active effort into promoting them. Or, you could 301 redirect these pages to similar but better converting pages instead.
There are some types of posts that will perform worse than others. For instance, a tutorial is going to drive a lot fewer sales than a list post that links to many of your own products. For these naturally low-converting pages, try adding prominent opt-in forms and pop-ups to build your email list.
6. Invest more in your top marketing channels
You can repeat the tactics you just learned in the Referrers report, too.
Start by enabling the Orders and Total Sales columns in the table and then sort by either metric.

In just a few seconds, you’ve uncovered your most profitable referrers. These are the sites you should continue to invest in and grow to further improve your sales.
7. Promote more expensive items to high AOV referrers
If you click the Toggle Columns button above the table, you can enable the Average Order Volume column for all referrers. Then, click on the Average Order Volume table heading to sort from highest to lowest.

This data can be used to decide which products you advertise on each platform.
For example, you may find that customers coming from Instagram tend to spend more. In this case, you should advertise your most expensive products on this platform.
8. Promote cheaper products to low AOV referrers
Continuing from the prior step, click the Average Order Volume table heading again to reverse-sort the table. Now you’ve got a list of referrers that send low-order-volume customers.
You can add a filter to only include referrers with at least one order to remove all of the $0 AOV results.
Your first instinct might be to deprioritize these sites, but they could be sending significant sales volume. Rather than trying to convince these customers to spend more, lean into their more thrifty spending patterns and try advertising less expensive products on these platforms.
For instance, if your global AOV is $100 but customers from Facebook are only spending $50 on average, then try promoting more products to them at that price point.
9. Invest in marketing channels with high conversion rates
Another powerful technique is to sort your referrers by the Conversion Rate metric.

Look for sites that send a lower number of visitors to your site but have an extremely high conversion rate. These are your hidden gems. You might find sites you’ve never even heard of in this bunch.
Your high-converting referrers are excellent sites to publish content on or buy advertising from. You could, for instance, find a great new email list or podcast to sponsor.
10. Divest from low-converting traffic sources
With your referrers sorted by conversion rate, it only takes one click to reverse-sort them and find your worst converting traffic sources.
Consider divesting from any platforms that convert poorly. Some of these sites might send a lot of sales volume despite their low conversion rate, but it’s worth trying to replace this traffic with higher converting sources instead.
11. Avoid referrers with high refund rates
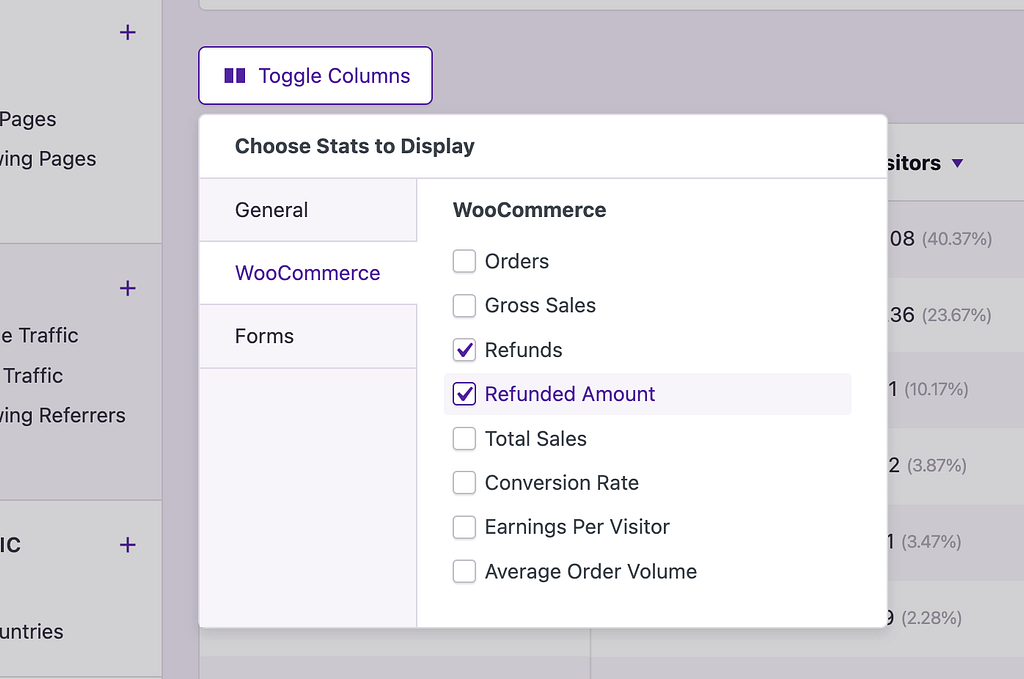
Another great way to evaluate your referrers is to check which ones lead to the most refunds. Enable both the Refunds and Refunded amount columns to see this data.
Check for any outliers with especially high refund rates. There may be an explanation, like an outdated advertisement or an old guest post that no longer provides accurate information.
If you can’t figure out why a certain referrer is more prone to refunds, then it might just be the nature of the audience on that site.
12. Offer multi-currency options for high sales volume regions
You can enable the Orders table column in the Geographic report to check where your customers are from.
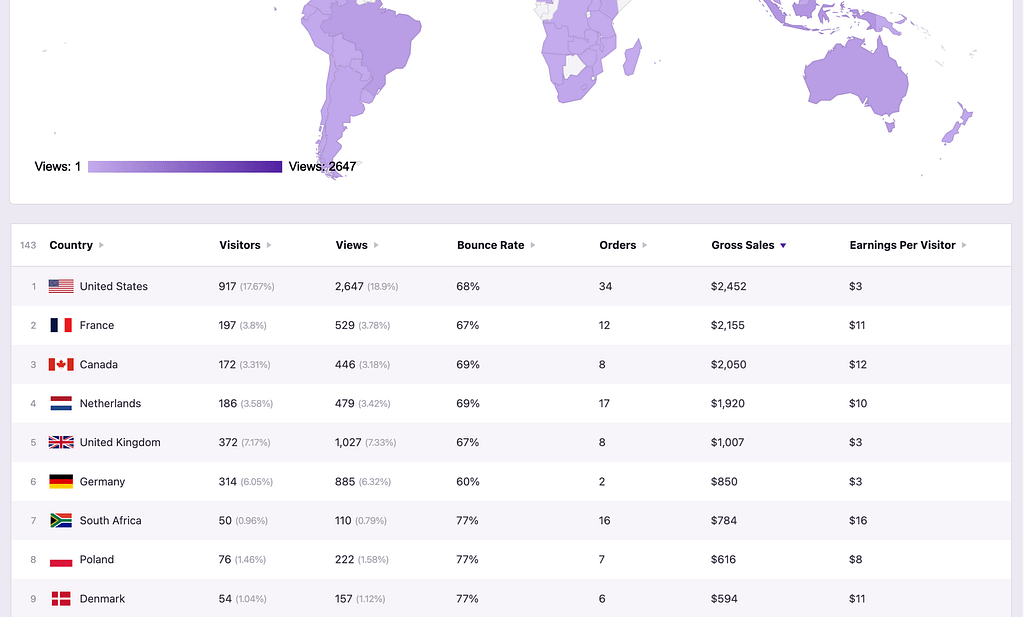
If you get a lot of sales from a country that uses a different currency, it might be worthwhile to support multi-currency options.
Offering visitors the choice to pay with their native currency can offer a significant boost to conversion rates. This increase in sales should more than offset the small fee paid to convert these currencies back into your own when withdrawing your funds.
Independent Analytics Pro is integrated with a few WooCommerce multi-currency plugins and SureCart’s native multi-currency feature.
13. Run ads in unexpectedly profitable regions
You may be surprised by some of the countries your customers are coming from.
If you’re running ads targeted to your home country only, you should consider expanding your ads to additional markets.
You can increase the geographic scope of your existing campaigns or create new ones catered to other countries where you’re seeing a large number of sales.
Make sure to base this decision on countries that send you lots of orders, and not on countries that you’re simply getting a lot of visitors from. You don’t want to waste your ad spend on a geolocation that isn’t driving significant sales volume already.
14. Improve your mobile design for better conversions
In the Devices report, you can compare Total Sales and Conversion Rates between the various device types used to visit your site:

In the past, it was common to see mobile sales lag behind desktop, but a lot has changed over the past decade. Now, shoppers are very comfortable completing purchases from their mobile phones, so you should see similar conversion rates across device types.
If any of these device types are lagging in conversion rate, try completing a checkout process yourself.
Are there any annoying or confusing steps when checking out via this device type? You may need to make adjustments to the design or text on the page to make things easier.
If you’re using WooCommerce, you can test your checkout flow using the awesome WooCommerce Order Test plugin.
15. Optimize your email marketing for orders instead of clicks
As an eCommerce store owner, you probably send frequent sales emails. If you’re not already using UTM parameters in all your links, make that a habit now!
You can create valid campaign URLs easily with the Campaign Builder added by Independent Analytics Pro.
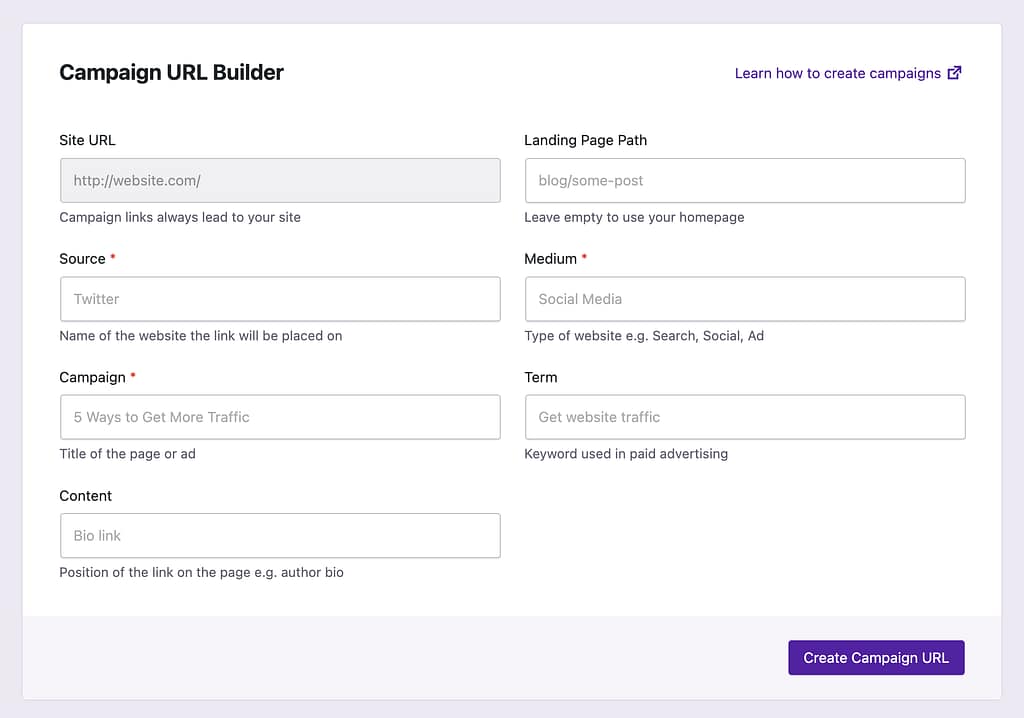
If you use campaign URLs in your emails, you’ll be able to see exactly how many people clicked on each link. Of course, your email marketing platform can already show you the number of clicks, so here’s where it gets even better…
In the Campaigns report, you can enable the same eCommerce metrics from before, like Total Sales, and view them for each individual campaign.
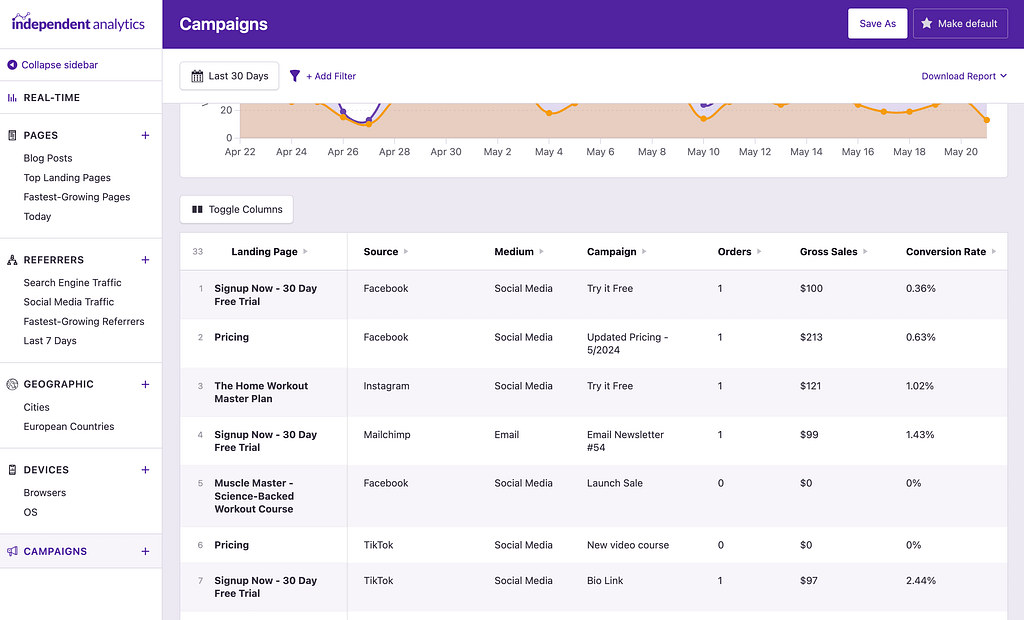
This allows you to see exactly how many sales were generated from each of your sales emails. This will work for one-time broadcasts and any ongoing email sequences/journeys you’ve created.
Then, you can optimize your emails based on those that are creating the most revenue, rather than optimizing for those getting the most opens and clicks.
16. Find your best-performing PPC ads
Platforms like Google Ads and Facebook Ads provide tons of data on the performance of your ads, but they also use “greedy” tracking. This isn’t a bad thing, but it means that if someone clicks on one of your ads and buys a product weeks or even months later, as long as they still have the cookie in their browser, the ad platform will take credit for the sale.
Again, that’s not a bad thing because it works well to see if your ad spend eventually turns into revenue. You can contrast this with the data that Independent Analytics Pro provides, which uses “last-click” attribution.
For example, if someone comes to your site from a Google ad and then they visit your site through an email the next day and buy something, IA Pro will attribute the sale to the email, rather than Google. This gives you more robust reporting when comparing results between the two platforms.
The key is to use UTM parameters in all of your ads, and then every time someone clicks on one, their visit will show up in the Campaigns report. This allows you to see the number of visitors and sales generated from each individual advertisement.
You can then increase your spending on the winning ads and drop the ones with a negative ROI.
17. Optimize your non-PPC ad spending
PPC platforms have their own analytics, but when it comes to non-PPC advertising, like sponsored emails, podcasts, and YouTube videos, you’re on your own. This is when the Campaigns report really shines.
Whenever you buy advertising or any sponsorships, always use a valid campaign URL with UTM parameters. This will let you track all eight eCommerce metrics for that particular campaign.
For example, if you pay to sponsor a YouTube video, have them include your campaign link at the beginning of the video description, and then you’ll get to see precisely how many people clicked that link and how many people purchased a product or submitted a form while on your site.
If you’re worried about the length of the campaign URLs, we have some tips for shortening links here.
Since UTM links can be used anywhere, you can use them in all of your social media posts too.
You might consider a post that gets 1,000 views or 100 clicks a success, but did it drive real business value? Using the Campaigns report, you can find out!
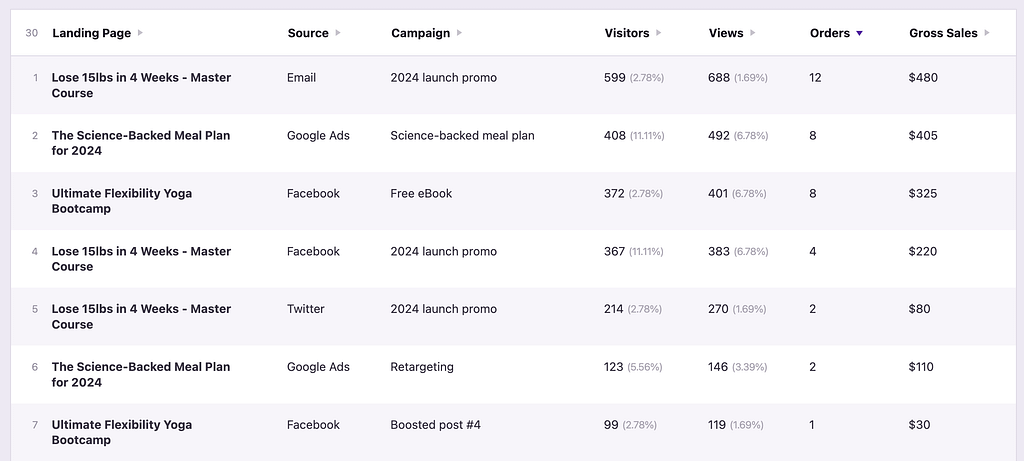
When creating your campaign links, make sure to consistently use “Social” or “Social Media” for the utm_medium field. Then, you can filter your Campaigns report to see only your campaign links post on social media sites, like this:

Once you have these results, you can sort your campaigns by Total Sales or Form Submissions to find which ones are driving the most business value.
For example, the post that sent you 100 visitors might have a high bounce rate and zero new opt-ins, but another post that only sent 50 visitors might have lead to a sale and five new email opt-ins.
Any post that converts visitors into subscribers or customers effectively can be boosted to reach a wider audience and grow your list. You can also use your successful posts as inspiration for future content.
You can watch our video tutorial here if you want to learn more about creating campaign links.
19. How to figure out where customers first find your website
IA Pro uses “last click” attribution, which means the last site to refer a visitor to your site gets credit for the sale. For example, if someone reaches your site via Facebook yesterday, then they visit via Google today and buy something while on your site, Google will get credit for the sale.
Last click attribution is great for finding the referrer that finally pushed a customer to buy. On the other hand, you are probably curious about where customers first found out about your site.
The trouble with “first click” attribution is that it is much less reliable due to the difficulty of accurately tracking people over weeks and months. It’s hard to rely on this data when you know there are inherent issues with accuracy.
A solution that works well is to check the “last click” referrer for a step earlier in your sales funnel. For example, most customers don’t buy something the first time they visit your site, but many of them will subscribe to an email offer. So here’s the big idea…
You can check where your form submissions are coming from in the Referrers menu, and that will give you a clearer picture of where your customers are first finding your website.

You can enable the Orders and Total Sales columns at the same time to compare which referrers are best at reaching new subscribers vs. which referrers are best at finally converting visitors into paying customers.
Speaking of form submissions, this brings us to our next section in this guide…
Getting more email subscribers
Virtually every business can be grown by increasing leads or email subscribers, whether you’re running an eCommerce store, a design agency, or a simple blog. The tactics below will give you direct, actionable steps to build your email list faster.
20. Optimize your entire site for conversions
If you click the Toggle Stats button, you can display the number of submissions and the conversion rate of each form on your site.

Most form plugins will show a conversion rate based on the number of submissions vs. form impressions. In the Quick Stats, the conversion rates are based on all visitors to the site. For example, if a form has a 1% conversion rate, this means 1% of all visitors submitted this form.
If lead generation is a major part of your business, then you likely have numerous forms on your site. The Form Conversion Rate metric will be especially helpful because it tells you the global percentage of visitors who submitted a form.

In other words, the Form Conversion Rate metric tells you how effectively your site is converting visitors into subscribers as a whole. This is a good metric to optimize for since it means your site is growing more effective and profitable as it goes up. For instance, you may add a new sitewide optin or pop-up that boosts the overall conversion rate of the site.
Independent Analytics Pro integrates with more than 20+ form plugins listed here.
21. Drive more traffic to your top performing pages
In the Pages report, attribution for form submissions goes to the page where the form is embedded.
This is very helpful if you have a form that shows on multiple pages, like a popup or a sidebar form. You can find out which pages are driving the most signups for your offer.
You can click the Toggle Columns button and then enable the Submissions column for any form you want. Then, sort the table by the submission metric to see the pages with the most impact.

Now, you can work on getting even more visitors to these pages since they are working so well. Depending on where your traffic is coming from, you may want to promote these pages on social media or add more internal links to direct more visitors to them.
22. Publish more pages like your successful ones
Using your list of top pages, find out what they have in common.
There may be a common thread, such as the format they use or the topics they’re on. Armed with this knowledge, you can publish more pages similar to your top-performing ones, and this will increase the number of leads your site is generating.
23. Promote your highest-converting pages
Each form includes a metric for both the submissions and the conversion rate, so you can display the conversion rate column in the table and sort by it to see which landing pages are best at turning visitors into subscribers.

Look for any pages that convert extremely well but have a low number of total visitors. They have the highest potential to drive leads if you can get more eyeballs on them. These are pages that you should work on promoting more, either through social media, SEO, or email marketing.
24. Re-optimize your under-performing pages
After analyzing your highest converting pages, you can reverse-sort the table to find your lowest converting pages.
You will find lots of pages with zero submissions, and therefore, a 0% conversion rate at the top of the table. Add a filter to only include pages with at least one submission to remove these pages.

Look for any pages that get a decent amount of traffic but convert poorly. What is different about these pages compared to the successful ones?
Try reformatting these pages, adding new opt-ins, or rewriting some of the content to boost the conversion rate.
25. Avoid publishing more low-converting content
If you try re-optimizing an under-performing page and it doesn’t work, then it may be time to write it off as a “loser.”
Learn from this page and pages like it. Avoid publishing any new content that is likely to perform as poorly as these pages.
You can enable the Post Category column in the table to check if there is any particular subject that performs better or worse than others.
26. Create new opt-ins for your top pages
It can also be useful to simply sort your Pages by those with the most visitors. The 80/20 rule applies to most websites, so 20% of your pages likely get 80% of the traffic. These high-traffic pages deserve special attention.
Try creating new variations of your existing opt-in forms specifically for these top pages. Modify the image and text in the form to better match the topic of the page, and you should see even higher conversion rates.
It isn’t worth doing this for every page, but if you have 1-5 pages bringing in a large percentage of your visitors, it is likely worth creating a few opt-in form variations for them.
While editing the opt-in form will work, you could take things a step further and create entirely new offers for your top pages. For instance, if you advertise a 30-day meal plan and your top page is about keto-friendly protein bars, you could create a new 30-day Keto meal plan or a list of the best Keto protein sources and advertise it on this particular page (and any similar ones).
27. Invest more in your best marketing channels
In the Referrers report, click the Toggle Columns button and display the submissions metric for any forms you want to promote. Then, sort by one of these columns.
For example, if you are tracking submissions on a contact form and a lead generation form, you probably want to promote the lead form and not the contact form. In this case, you would display submissions for the lead form only and then sort by that metric.

This gives you a list of referrers that are driving the most new leads to your site. You should continue investing in the traffic sources that are working the best, and divest from those that are providing lackluster results.
28. Experiment with unexpected high performers
It’s also a great idea to sort your referrers by form conversion rates.
This can unveil sites that have sent only a handful of opt-ins but have converted at a higher-than-average rate. There may even be some sites you’ve never heard of!

This is probably the best way to make new gains with your business. You will likely find at least one site here that is converting much better than you expected. You can then focus more on these high-converting sites, spending more time and money on promoting your site there.
When sorting by highest to lowest conversion rate, you’ll probably find a lot of sites with extremely high conversion rates but only 1-2 total submissions. You can add a filter to exclude referrers with fewer than two submissions to remove these sites from your results.
29. Divest from low-performing referrers
If you click on the conversion rate metric again, you can reverse sort the table to find your referrers with the lowest conversion rate. You’ll want to remove any results that have zero submissions recorded using a filter, like this:
Look for any sites that are sending lots of visitors but converting at a lower-than-average rate. These are sites you should consider investing in less, in favor of other traffic sources that convert better.
30. Optimize your mobile opt-in forms
If you visit the Devices report, you can enable form submissions there to compare both the total submissions and conversion rates between device types.

These days, people are so comfortable using their mobile devices for everything that you shouldn’t see a significantly lower conversion rate for mobile. If you do, here are a few ideas.
First, if you’re showing a full-screen pop-up, it could be overwhelming and annoying for mobile visitors. On the other hand, if you show a pop-up on desktop but not mobile, then that’s an obvious explanation for the lower opt-in rate.
For mobile devices, you can display a persistent email optin form along the bottom of the screen. This will give excellent visibility to the offer without taking up too much screen space.
Rather than showing the form fields immediately, you could display a “Subscribe Now” button that opens the full opt-in form when clicked.
31. Replicate your most successful campaigns
Using UTM parameters when linking to your site will let you track the performance of individual links in the Campaigns menu. You can see the visitors from each link and also the number of form submissions.

Sort your campaigns by Submissions, and this will give you a list of your most successful lead generation campaigns. Try to replicate any campaigns that proved successful.
For instance, if you sponsored a YouTube video and got a lot of signups, try sponsoring another video or reaching out to a new YouTuber with a similar audience.
32. Double down on high-converting campaigns
After finding your campaigns that drove the most total submissions, sort the table by Conversion Rate to find the campaigns that have converted the best.

These are campaigns that you should explore further.
For some reason, they didn’t get a lot of reach, but they were extremely effective for the people who did click on the link. If there’s any way to give these campaigns more visibility or replicate them, it’s worth investing more.
For example, let’s say you published a post on Facebook that only reached a small number of people but converted them effectively into leads. You could try “boosting” this post to reach a wider audience and see if it continues to convert as well.
Try this: take your best-performing social media campaign and pair it with your top-converting landing page. See if you can create a super effective ad this way.
Boosting your affiliate commissions
Affiliate revenues revolve around getting clicks so that you get credit for sales and earn your commission. There are numerous ways the data in Independent Analytics Pro can be used to optimize your marketing to generate more clicks than before.
33. Track all your affiliate links in seconds
If you’re serious about affiliate marketing, then you probably use a tool like Pretty Links or ThirstyAffiliates to create and manage your links. The common advice is to use these tools to redirect your affiliate links through a subdirectory, like this:
mywebsite.com/go/recommended-productIf your affiliate links are redirected in this way, you can easily track clicks on all of them by adding a Subdirectory link pattern in the Click Tracking menu.
With this link pattern added, every click on every link that points to a URL including the /go/ subdirectory will be tracked.
In a matter of seconds, you’re now tracking all the affiliate links on your site. In the Clicks report, you’ll see clicks for each link show in the data table, like this:
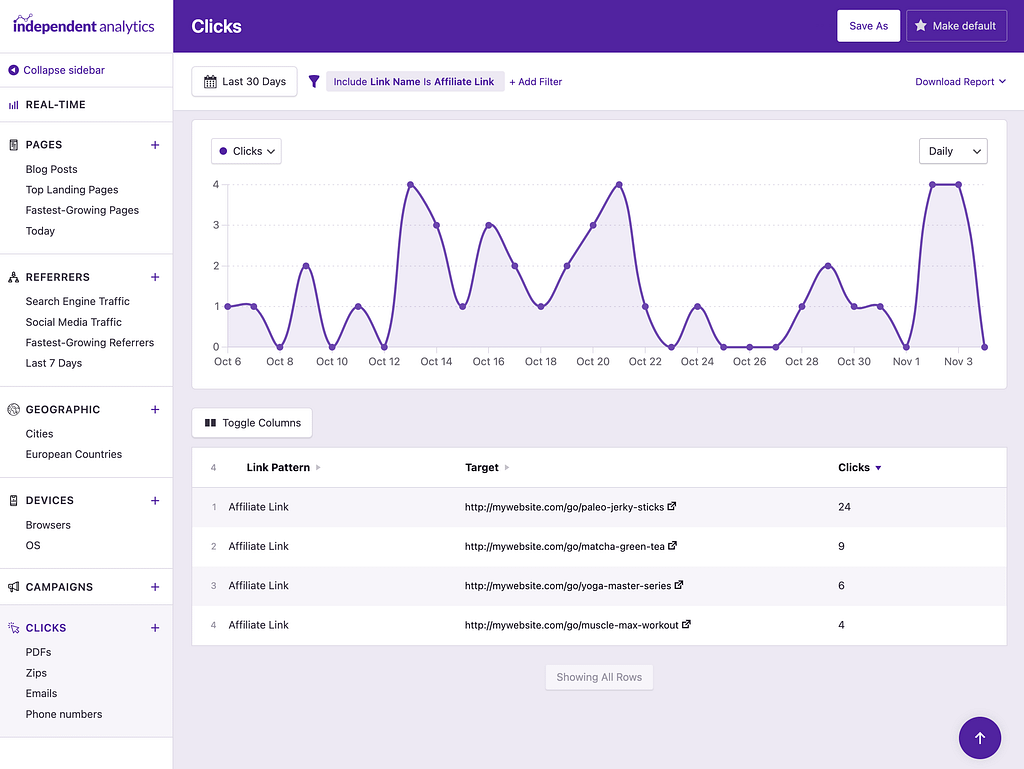
The Link Pattern is the same for them all, but in the Target column, you can see the full URL that each link points to. This will let you differentiate clicks between different links.
If you’re not using a subdirectory for your affiliate links, you could create a Domain link pattern for each vendor instead. For instance, you can track clicks on all links pointing to Amazon.com. If you have dozens or hundreds of domains you need to track, you can enable the External link pattern instead to track all external links.
34. Promote your pages that drive the most clicks
In the Pages report, click the Toggle Columns button and enable the Clicks column. Then, click on the Clicks table heading to sort your pages by those with the most clicks.

You can now see which pages are generating the most clicks on your site.
Compare the number of clicks to the number of visitors to see which ones convert the best. Then, work on driving more traffic to these pages to increase the number of clicks (and commissions) you get.
If you want to know which links were clicked, in particular, you can hover over a page and click the magnifying glass button to open a Solo report.
In the Solo report, navigate to the table at the bottom and switch to the Clicks tab. This will show you each tracked click on this page.

35. Publish more pages like your top performers
Now that you’ve found the pages on your site getting the most clicks, try and replicate their success with more content.
Are there any patterns you can find between these pages?
For instance, you might find that your “Top 10” posts get more clicks than your tutorials, or a certain topic tends to get more clicks than others. At the end of the day, affiliate marketing revolves around getting clicks, so optimizing for this metric is better than simply optimizing for traffic.
You might also find it helpful to filter your results by Page Type or Post Category. This will let you isolate groups of content for further analysis.
36. Learn from your “losers”
If you click on the Clicks table heading again, you can sort the table from lowest to highest clicks. Then, add a filter to exclude any pages with zero clicks, which may be irrelevant to your analysis.

Study the under-performing pages here and find out what you can learn from them.
Is there a certain format that isn’t working or a topic that doesn’t appear to engage visitors? Avoid creating more pages like these ones in the future.
Don’t fall into the trap of optimizing for traffic. It can be exciting to publish a post that gets lots of visitors, but if it isn’t contributing to your affiliate clicks or email opt-ins, then it’s not helping your business.
37. Focus on your most profitable referrers
For an affiliate site, clicks = money, so you can find your most profitable traffic sources by finding those driving the most clicks.
In the Referrers report, enable the Clicks column and then click on the table heading to sort your referrers by this metric.

This reveals which referrers are leading to the most clicks on your website.
Make sure to compare this with the total number of visitors as well to gauge the conversion rate. Even if a site is sending you a lot of visitors, it’s not a valuable traffic source if it isn’t creating a substantial number of clicks (or email opt-ins).
Find the referrers that generate the most clicks and invest more in marketing on these sites.
Remember, you can open a Solo report for any referrer to see exactly which links were clicked.
38. Abandon referrers sending few clicks
Next, you can reverse sort the table by fewest to most clicks. After doing this, you may want to add a filter to exclude referrers with less than five clicks, like this:
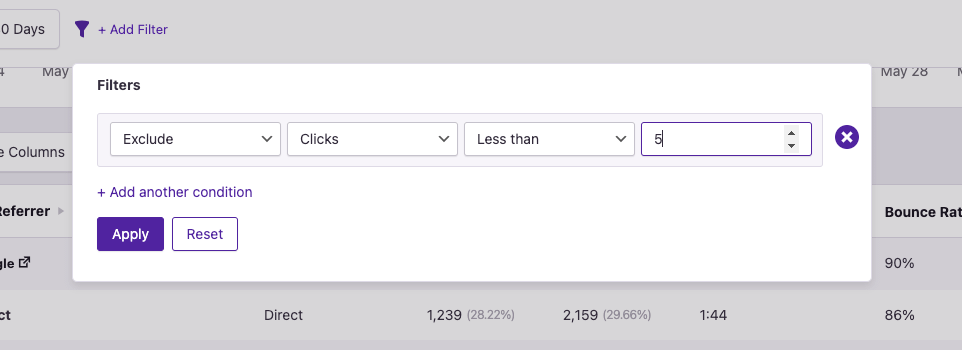
With the fat trimmed off, you can now see which of your referrers is performing the worst in terms of delivering clicks.
These are sites that are not contributing materially to your bottom line. It would be best to give them less attention and focus more on the sites that drive highly engaged visitors to your website.
39. Optimize your mobile design for clicks
In the Devices report, compare the number of clicks you get on desktop devices vs. tablets and mobile devices. Make sure to consider the total number of visitors as well.

It’s normal to see fewer clicks per visitor on mobile devices compared to desktops.
For instance, if you publish “Top 10” posts, visitors on laptops are more likely to open product links in new tabs, whereas mobile users might be more selective about which links they click because it takes more work to navigate between each tab.
However, if you see a really significant difference in clicks on mobile devices, then you may want to make some design changes.
For example, if you have offers in your header and sidebar that don’t show on mobile devices, try adding a sticky bar to the bottom of mobile screens with a persistent offer there. That will drive clicks up immediately.
40. Double down on your best campaigns
Campaign links can be used anywhere, from paid ads to guest posts and social media content. In the Campaigns report, it’s worth sorting all of your campaigns by clicks to see what’s working and what isn’t.

This is so powerful because you can see the clicks generated from individual links.
The Referrers report can show you how many clicks you get from Facebook overall, but the Campaigns report can show you stats for each individual link pointing to your site. This can help you figure out which posts are performing the best so you can create similar content in the future.
When promoting your site across the web, you should use a campaign link any time you have control over the URL. This will give you more data, and the more data, the better!
41. Send more effective marketing emails
Your email provider can show you the open rate and clicks that each email gets. Using this data to optimize your emails can help you drive more traffic to your site, but that is not the best metric to optimize for.
Instead, you can track how many affiliate link clicks you get on your site from each email. This way, you can optimize for the emails that drive the most affiliate links, instead of optimizing your emails for traffic to your site.
In the Campaigns menu, start by adding a filter to only see campaigns sent via email, like this:

Then, you can enable the Clicks column and sort by this metric to see which emails create the most clicks on your website.
Try to publish more emails like these ones, since they’re driving the most affiliate clicks.
42. Learn from your failed campaigns
When it comes to marketing, there are always failed campaigns, but you’re not doomed to repeat the same mistakes.
You can reverse-sort your Campaigns from lowest to highest clicks to find the ones that were ineffective at generating clicks. Try to find patterns in these campaigns, like the messaging, landing page, or site where they were promoted, and avoid creating similar campaigns in the future.
43. Optimize your most clicked links
In the Click Tracking menu, you can also track links via class.
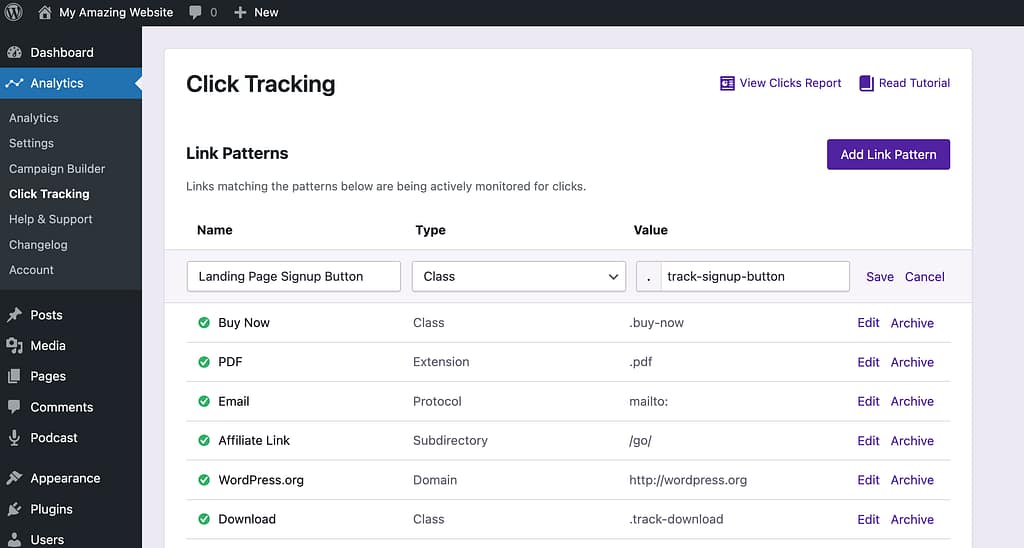
Adding a class to a link is quite simple, and we have a tutorial on how to add classes to links here.
This is a great way to track elements within templates shown across the entire site.
For instance, let’s say you have a widget in your sidebar. This same widget is displayed on every page of the site, so if you track a link within this widget with a class, you’ll see the total clicks it gets across all pages in the Clicks report.
Links that you use across your entire site will likely get the most clicks. These may be links you place in the sidebar, header, or in reusable templates used across your posts and pages.
As an example, if you publish a lot of product reviews, you likely use the same template for the rating and “Buy Now” button.
You can compare clicks across each of your links in the Clicks report:

Find the links that are getting the most clicks and work on optimizing the surrounding copy and graphics to further boost your click counts.
For example, if you have a widget link that gets 500 clicks/month, try improving the design, text, or images used in the widget to further boost clicks. A quick optimization here could result in an extra 100 affiliate clicks/month.
You can also open a Solo report for any link to see which pages it’s getting clicked on the most. This may help you further optimize your link for additional clicks.
If you have any links that get 100 clicks/month or more, then you could benefit from split testing with a plugin like AB Split Testing. This can help you optimize your on-site ads in a scientific and methodical way.
44. Re-optimize under-performing links
Check your Clicks report for any links that are under-performing.
For instance, imagine you have two sidebar ads, and one is getting 3x as many clicks as the other. You should consider replacing the less popular ad with a new one.
You might want to update the design or sales copy, or replace the ad with a completely different product recommendation.
45. Promote your top products even more
If you were able to track your affiliate links using the subdirectory pattern, then they’ll be neatly labeled in the Clicks report, and you can tell which product each link points to based on the Target URL.
For example, in the screenshot below, you can see that the first recommended product is Paleo jerky sticks, whereas the second product is Matcha green tea.
Considering your top products are performing so well, you should consider promoting them even more widely across the site. You could include them in new posts, add them to more of your existing posts, or include them in sitewide elements, like header, sidebar, footer, and pop-up links.
46. Redesign your reviews to get more clicks
Most affiliate product reviews will include a rating widget of some kind, a buy now button, and maybe even a comparison table.
Since these elements come from templates, you can track clicks on these buttons across all of your pages very easily.
For instance, if there is a “Buy Now” button included in your review posts, you could track clicks on that Buy Now button using a class, and then you’d see how many clicks that particular button gets across all of your review pages.
By tracking clicks on buttons that come from plugins or your theme, you can compare how often they each get clicked. For instance, you can compare the total clicks on a “Buy Now” button that shows at the top of your reviews vs the “Buy Now” buttons that show up in the comparison table.
These insights can help you design your review pages to get even more clicks.
Give your marketing a boost
Now you’ve seen the power that Independent Analytics Pro holds to grow your business, whether you’re looking to increase your eCommerce sales, email opt-ins, or affiliate commissions.
But we’ve still only scratched the surface.
Independent Analytics Pro includes numerous other features that make your analytics even more convenient and powerful. These features include the Overview report, automated email reports, and real-time analytics.
If you’re ready to unlock every feature for your website(s), click the link below to review the available packages.
Click here to view the pricing
As a buyer, you’re protected by our 30-day money-back guarantee. Give it a try on your site, and if you’re not satisfied, send us an email, and you’ll get your money right back.
