This feature is only available in the Pro version of Independent Analytics.
In order to use the Campaigns dashboard, you’ll want to start by creating campaign links with the Campaign Builder.
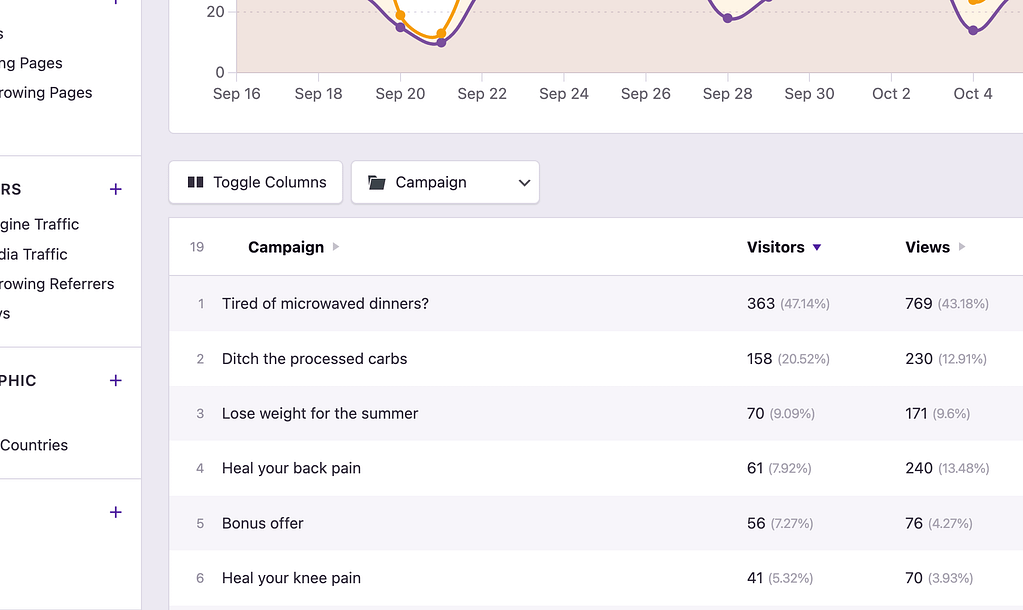
The links you create will show up in the Campaigns dashboard once they’ve received at least one click. In the Campaigns dashboard, you’ll see every view and visitor that came from a click on a campaign URL.
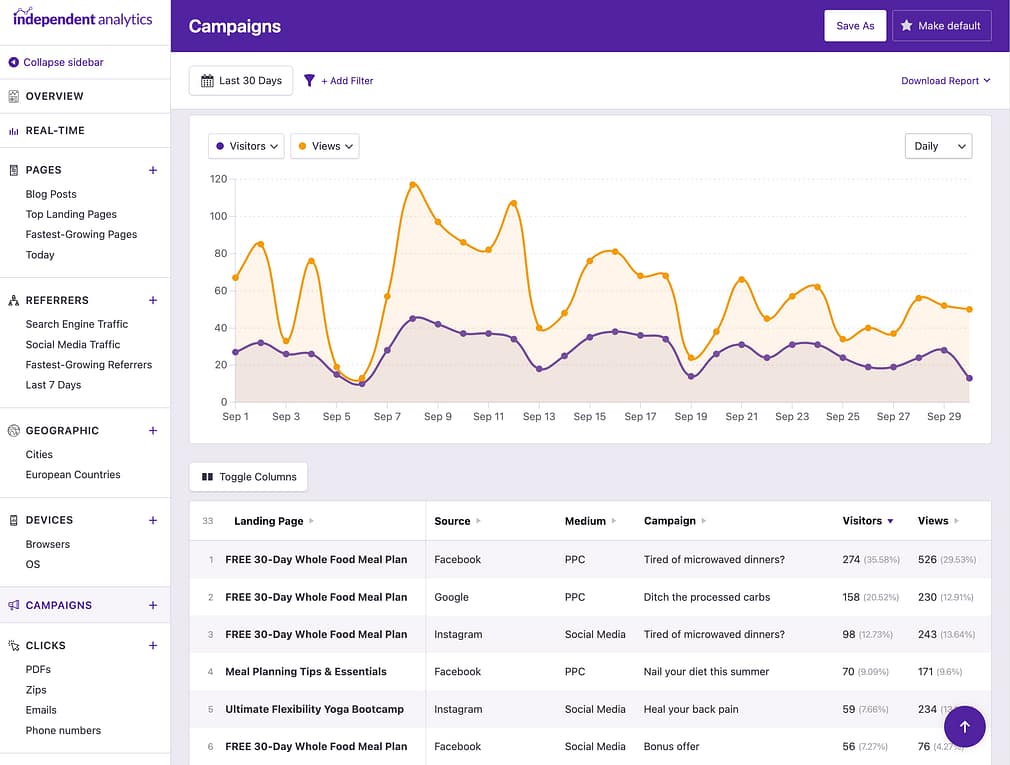
With this dashboard, you can see exactly how many views and visitors you’ve received from each campaign URL.
The Terms and Content columns are hidden by default but can be shown by using the Edit Columns option.
Like other dashboards in Independent Analytics, the table rows can be filtered by any of the columns.
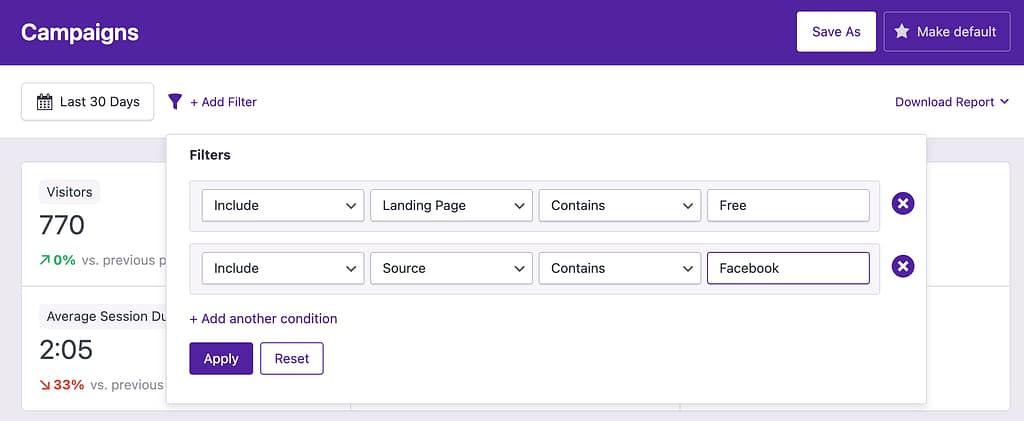
You can follow the filters tutorial to learn how this works.
And like the other dashboards, you can change the date range and sort the table by any of the columns.
With the Campaigns report, you’ve got one centralized location where you can review your campaign performance any time.
Grouping options
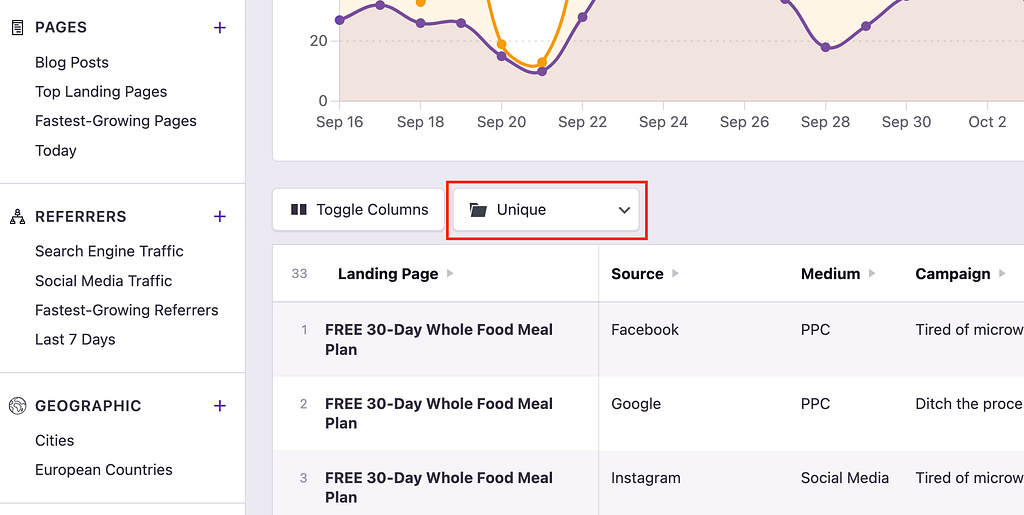
By default, the table will show you every unique campaign. This is very useful, but it can become problematic if you have tons of unique Term and Content fields. This can cause a single campaign to occupy dozens of rows, making it hard to review its performance.
For this reason, you will find a dropdown option above the table that lets you switch the row grouping from Unique to Landing Page, Source, Medium, or Campaign.
For example, if you group the table rows by Source, it will look like this:
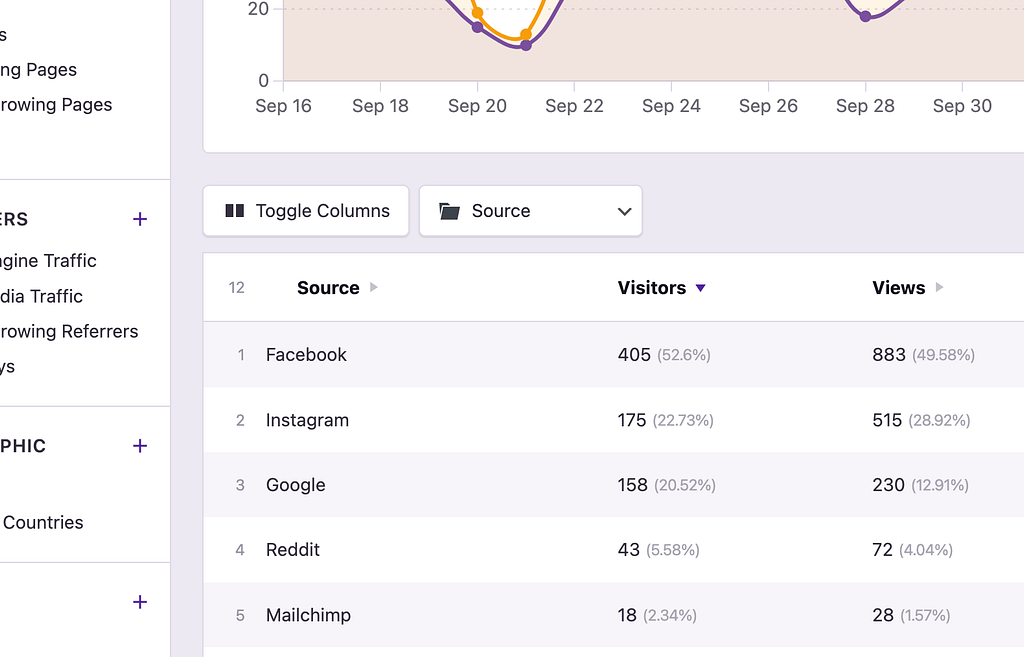
This lets you see exactly how many campaign visitors you’ve gotten from individual sources, like Facebook or your Mailchimp emails.
Likewise, you can group the rows by the Campaign field.
This reveals the performance of each campaign, regardless of the landing page, source, or medium. This makes it much easier to evaluate and compare your marketing campaigns to find out which ones are working best.
