
You know how many pages per session your site gets.
Or maybe you don’t.
It’s hard to understand if your pages per session metric is good without anything to compare it to.
Is 1.10 a good value? Or should it be 4.25?
In this post, you’re going to learn:
- What a good pages per session metric looks like
- How to track pages per session
- How to optimize your pages per session metric
I know you’re excited, so let’s dive in with some benchmarks.
Pages per session benchmarks
It’s important to keep in mind that a “good” pages per session value changes wildly based on the type of website.
With that said, here are some general guidelines you can use:
- Blog: 1.4
- Business: 1.7
- eCommerce: 4.0
Blogs have difficulty achieving a high pages per session metric because the majority of their traffic is usually from SEO. The common visitor behavior is to find the answer they’re looking for and leave without exploring further.
General business websites tend to have a higher pages per session value because visitors are more likely to be researching the product/service offered, requiring visits to multiple pages.
eCommerce sites have a very high pages per session metric because they’re designed for browsing. It’s not uncommon for someone to visit a category page and open up ten tabs on an eCommerce store, whereas this is hard to imagine happening on a blog or general business website.
Regardless of which type of site you’re running, you’ll need a reliable way to track this metric before you can analyze and improve it.
You might want to explore benchmarks for average session duration next.
How to track pages per session
If you’re not sure how to track pages per session, there are some great free tools available.
For WordPress users, check out our plugin, Independent Analytics.
It’s privacy-friendly, installs in seconds, and is much easier to use than more complex analytics tools like GA4.
You can find the full analytics suite inside your WP dashboard, making it easy to check your site’s performance each time you login.
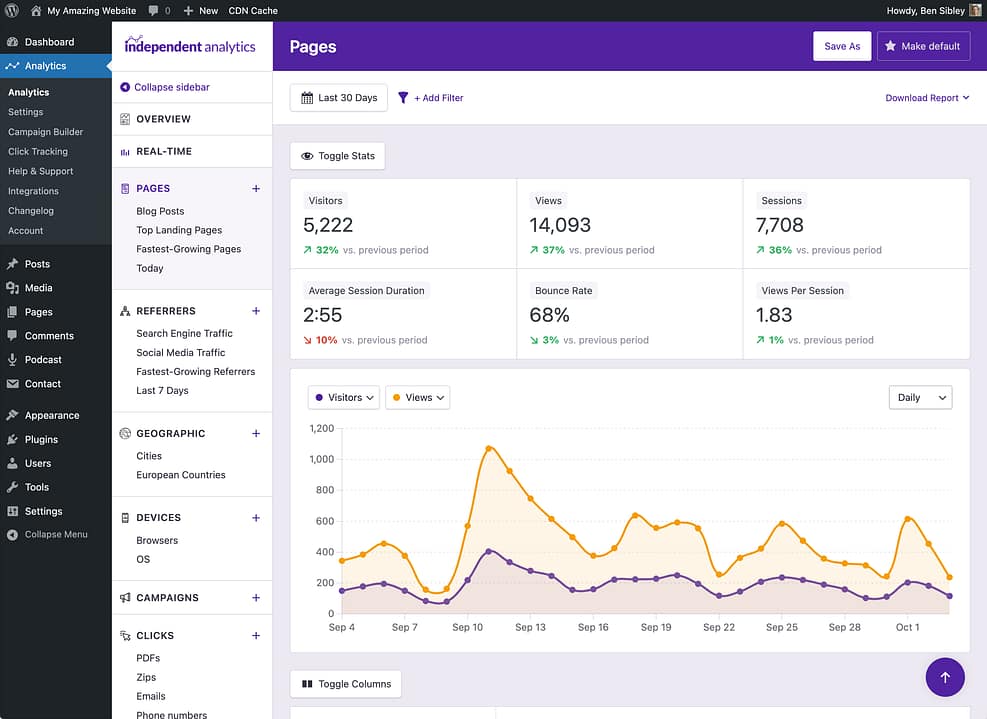
Now, of course, you’re probably wondering about that pages per session metric.
In Independent Analytics, we call this metric views per session, and you can find it in the Quick Stats at the top of the page.
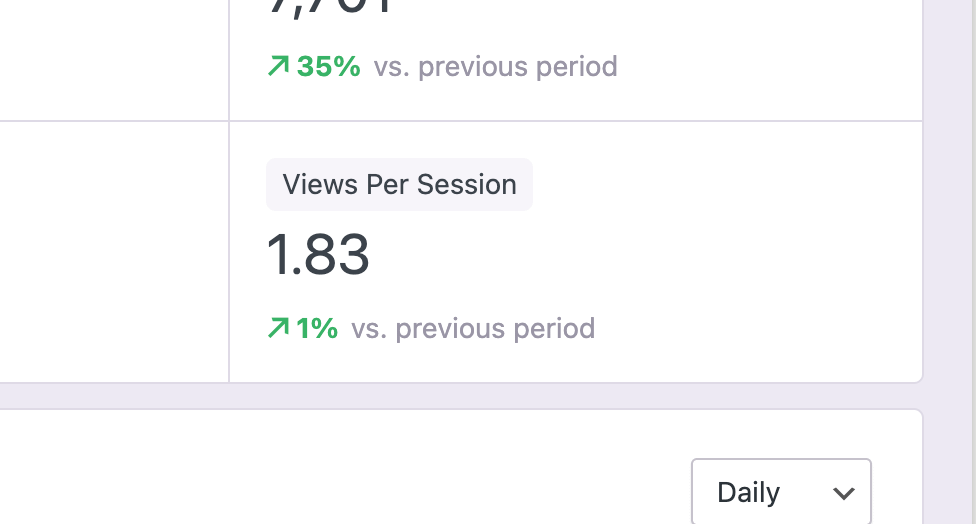
We’ll be using “views per session” and “pages per session” interchangeably throughout the rest of this article.
So far, we’ve only discussed the views per session metric in the context of your entire site. While you can easily find this metric as shown above, you can find it for individual traffic sources too.
For example, if you visit the Referrers menu, you can enable the Views Per Session column and compare engagement across all your traffic sources.
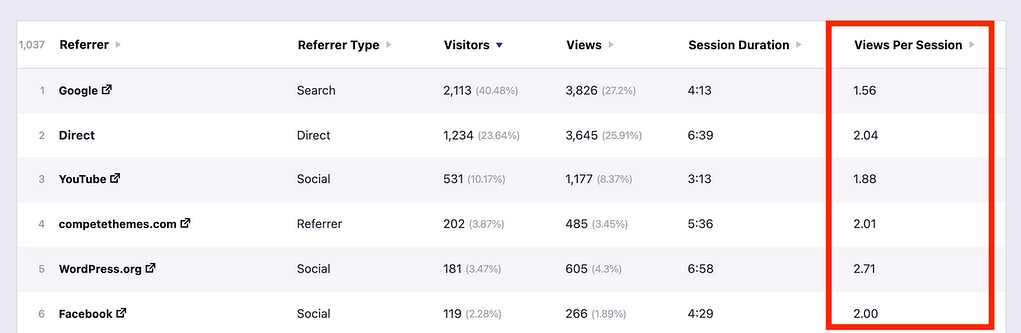
This is extremely useful because you can find out which sites are delivering the highest quality traffic. You may find a source sending loads of visitors that barely engage with your site but another source sending fewer, more highly engaged visitors.
Since you already know your global views per session, you can easily tell which referrers are sending higher vs. lower-than-average quality visitors.
Now that you know how to thoroughly analyze your views per session, let’s talk about how to optimize it so you can reach and exceed the benchmarks.
You can repeat this same analysis for every country, device type, and browser too.
How to optimize pages per session
Like all metrics, there are systematic steps you can take to improve your site’s pages per session.
Here are a few simple ideas to get you started:
Shift your traffic focus
One of the easiest ways to increase your views page session is to change the balance of traffic you’re getting.
Find the referrers sending visitors with the most page views per session and double down on getting more traffic from them.
Additionally, find the traffic sources that are sending low-engagement visitors and minimize the visitors you get from these sites.
Optimize for more devices
Check the Devices report and compare views per session by device type. If people are browsing your site a lot more on mobile vs. desktop traffic, then you may need to review the design and find ways you can improve it so that engagement on mobile and desktop both match.
Funnel traffic to high-engagement pages
One last smart way to get people to view more pages on your site is to promote the pages that get the most engagement.
In the Pages report, you can enable and sort by the Exit Rate column to find where visitors are leaving your site.
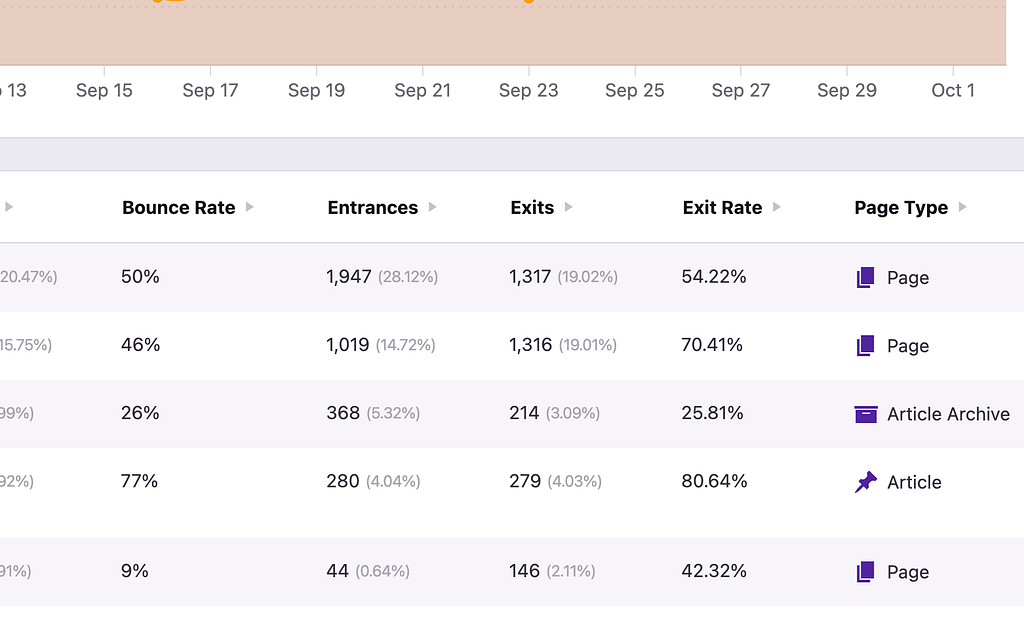
The Exit Rate shows you how likely someone is to leave a page when they view it. In other words, the pages with the lowest Exit Rate are pages where your visitors are most likely to click on another page instead of leaving.
Following this logic, if you use internal links in your content, sidebar, and slide-ins to promote low Exit Rate pages, more visitors will reach those pages and continue to browse, thus increasing your pages per session metric.
We have benchmarks for what a good exit rate is too.
Start optimizing today
Now you know what a good pages per session metric looks like for your website, how to track this metric, and how to optimize for it.
If you liked what you saw of Independent Analytics here, you can download a copy for free to get started:
Get started with Independent Analytics
Thanks for reading this guide on what a good pages per session value is, and please post any comments or questions you have below before leaving.
