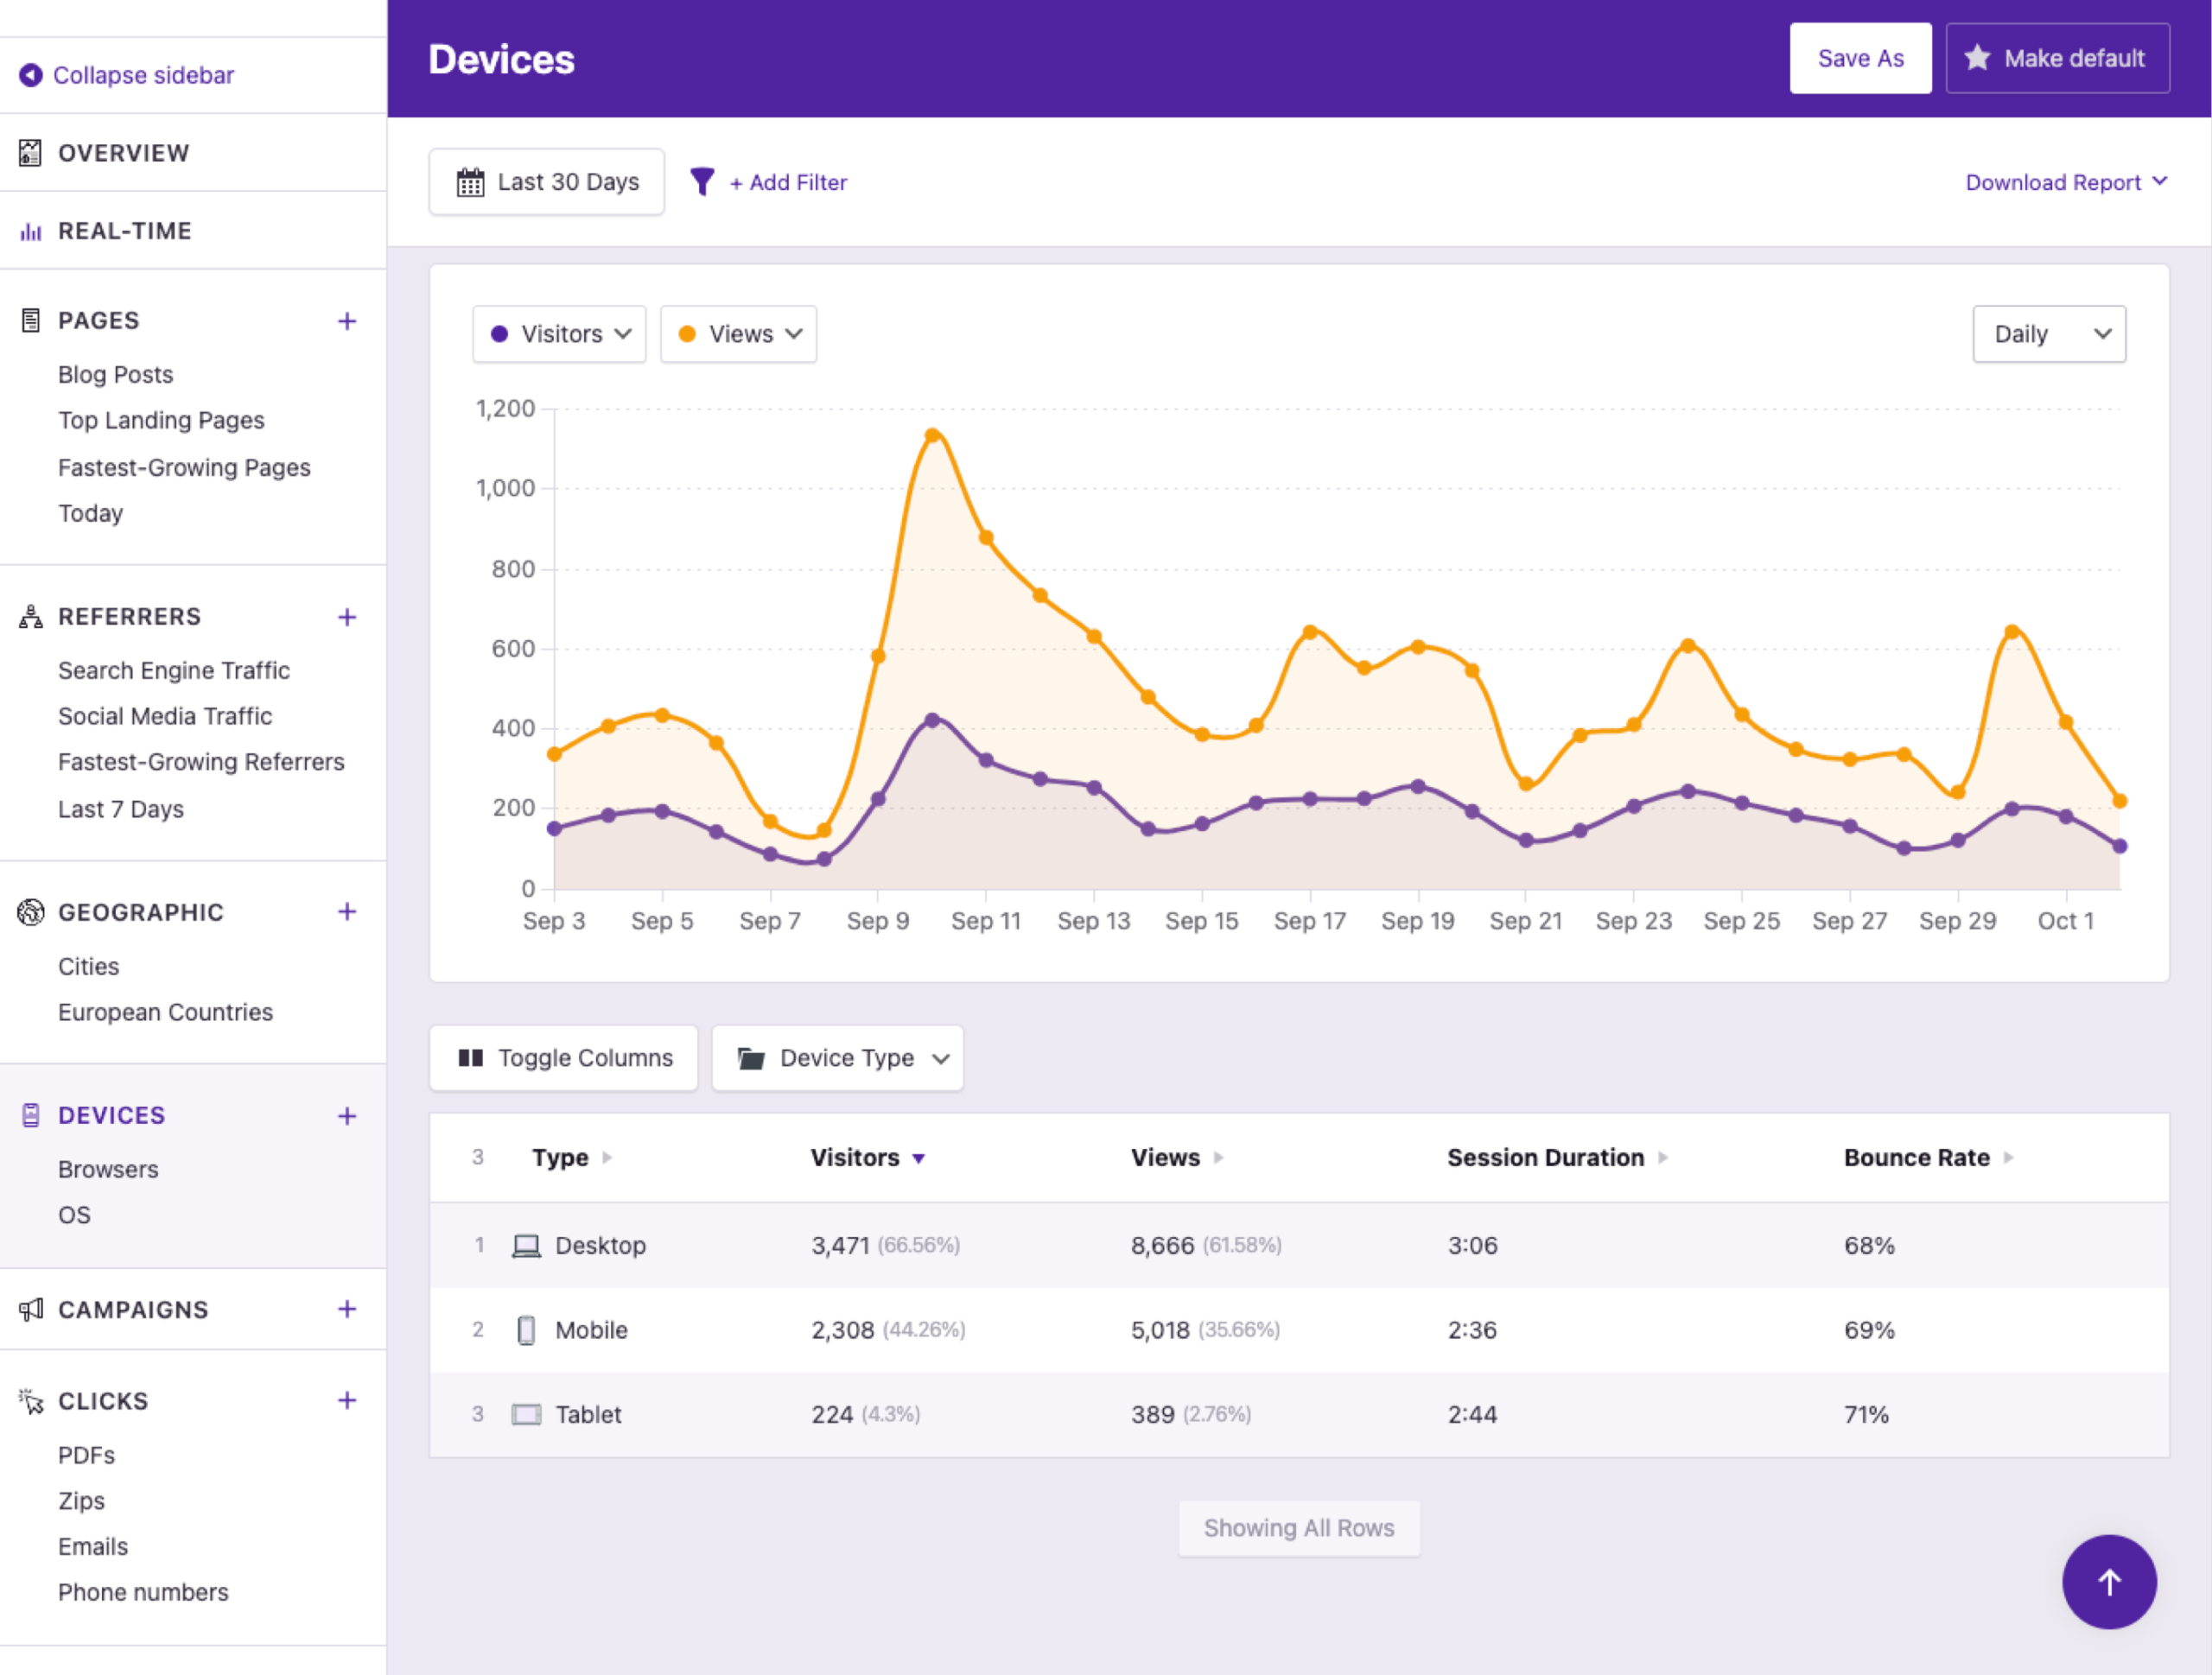
The data table will quickly show you what kind of devices your visitors are using the most. This data can help guide the development and design of your site, as you cater towards the appropriate screen sizes.
Compare Mobile vs. Desktop Traffic
Check how many visitors access your site via mobile, tablet, and desktop with the Devices Report.
You need to know how many visitors reach your site via mobile vs. desktop and whether they're engaging with your site, or bouncing due to bad design.
Here's How Device Data Helps You Improve Your Website
Get a full list of every browser used to visit your website. It’s important to check your site in all the top browsers to ensure it displays properly in each of them, and this list is more accurate for your site than simply Googleing a list of the top browsers.
Tracking which OSes are used by your visitors can be handy for understanding their preferences and technical competencies.
Easily compare the bounce rates, session durations, and views per session of each device type.
Use the filtering system to find browsers with more than 100 visitors, or isolate a single device type for further analysis. You can filter by any of the metrics available in the data table.
Running a website with limited data stinks
The Devices Report gives you a clear view of how many people access your site via each device type. This data is imperative for understanding your visitors and spotting low engagement caused by design or technical issues. We use the Devices report to ensure all our pages are performing well on mobile and desktop.
View PricingHere's What Our Customers are Saying
“At Webdev.com, we utilize Independent Analytics for our websites, and we can't recommend it enough. This tool is incredibly useful and serves as an excellent alternative to Google Analytics, making it easier for our customers to access the insights they need. Highly recommended. A++”
“I have a website and blog for my freelance editing business, and Independent Analytics is so much better for what I need than Google Analytics. It's easier and faster to find the data I want to see, and the aesthetics are miles better.”
Get Started
Frequently Asked Questions
-
Toggle FAQ
What device types are recognized?
The recognized device types are desktop, tablet, mobile, smartwatch, and TV.
-
Toggle FAQ
Are device models named in the report?
No, this data is not included. Device model data is unreliable, and we found that it was more misleading than helpful.
-
Toggle FAQ
Can I see mobile vs. desktop traffic in WordPress without Google Analytics?
Yes. The Devices report in Independent Analytics shows the breakdown of desktop, mobile, tablet, smartwatch, and TV traffic, along with the specific browsers and operating systems your visitors use. It’s included in the free version and is an alternative to Google Analytics entirely.
-
Toggle FAQ
How do I check if my mobile bounce rate is higher than desktop?
The Devices report in Independent Analytics shows bounce rate, session duration, and views per session for each device type side by side. You can easily compare them and filter or sort device types by bounce rate.
If you have any questions, you can click here to get instant answers from our AI Assistant, or email us directly via support@independentwp.com to reach a real person.
