This feature is only available in the Pro version of Independent Analytics.
When someone visits your site, they eventually leave. Everything they do while on your site is included in one session.
With the User Journeys report, you can view every single one of these sessions:
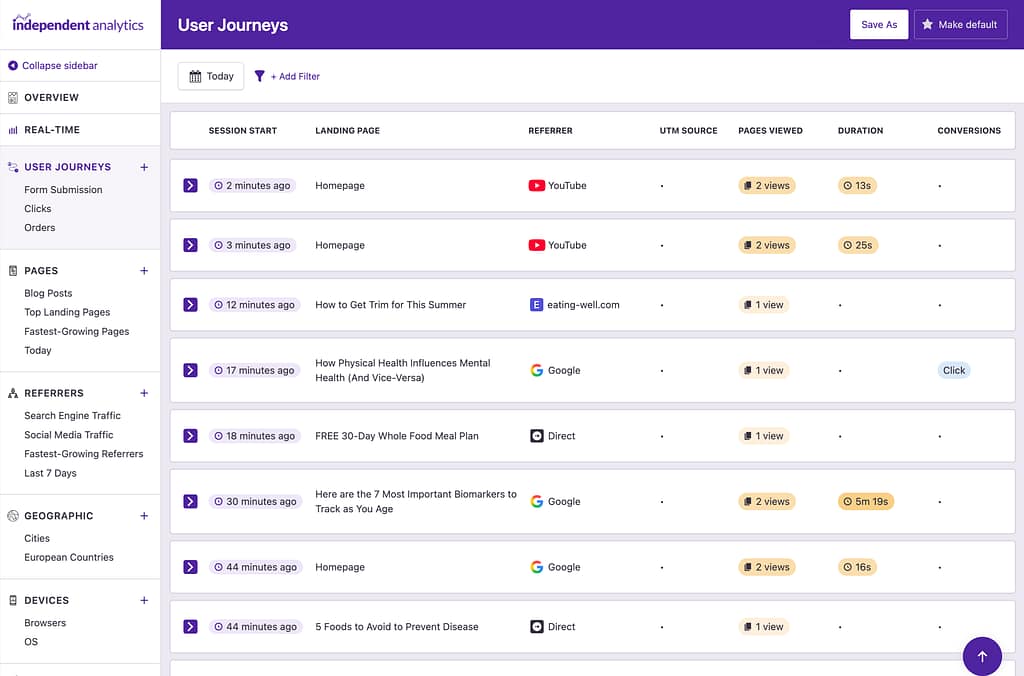
When you visit the User Journeys report, you’ll see the most recent session at the top. Each session includes essential data so you can analyze it at a glance.
These are the data points included in each session:
- Session Start: The time that the visitor first arrived at your site.
- Landing Page: The page the visitor arrived at.
- Referrer: The site the visitor came from.
- UTM Source: The value from the
utm_sourceparameter, if one was used (more info on campaign parameters here). - Pages Viewed: The number of pages the visitor looked at during their session.
- Duration: How long the visitor was on your site.
- Conversions: Indicates whether there was a click, form submission, or eCommerce order recorded during the session.
These data points make it easy to pick out interesting sessions to explore further. To learn more about a session, all you have to do is click on it, and the timeline will be revealed.
The Pages Viewed and Duration values are color-coded, so sessions with higher engagement use a darker orange, and less engaged sessions use a lighter orange.
Exploring the timeline
When a session is clicked on, it reveals a complete timeline of the visitor’s experience on your website.
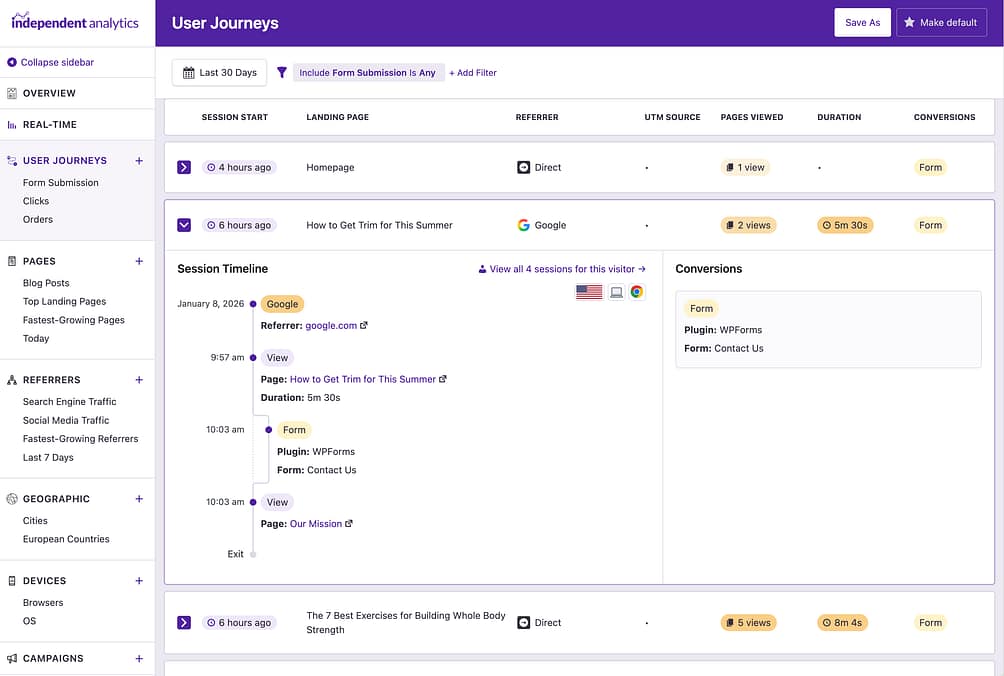
It begins with the date of their arrival and the site they came from, followed by each of their views. Every view includes a timestamp, the page they viewed, and how long they viewed that page.
You’ll also notice that clicks, form submissions, and eCommerce orders are displayed within the timeline with timestamps for when they occurred.
On the right side is the Conversions log, which lists every tracked event. This can be useful if a session has 10+ views and you want to quickly find out what form they submitted or how much revenue an order was worth without scanning the entire timeline.
To the right of the timeline, there are icons indicating the country, device type, and browser used by the visitor. You can hover your cursor over any of them to reveal a tooltip with the country/device/browser name.
Above the icons, you may see a link that says “View all X sessions for this visitor.” If IA Pro recognizes other sessions for this visitor, you will be able to click on this link to see all of their recorded sessions on one page.
Here is an example of a visitor page accessed in this way:
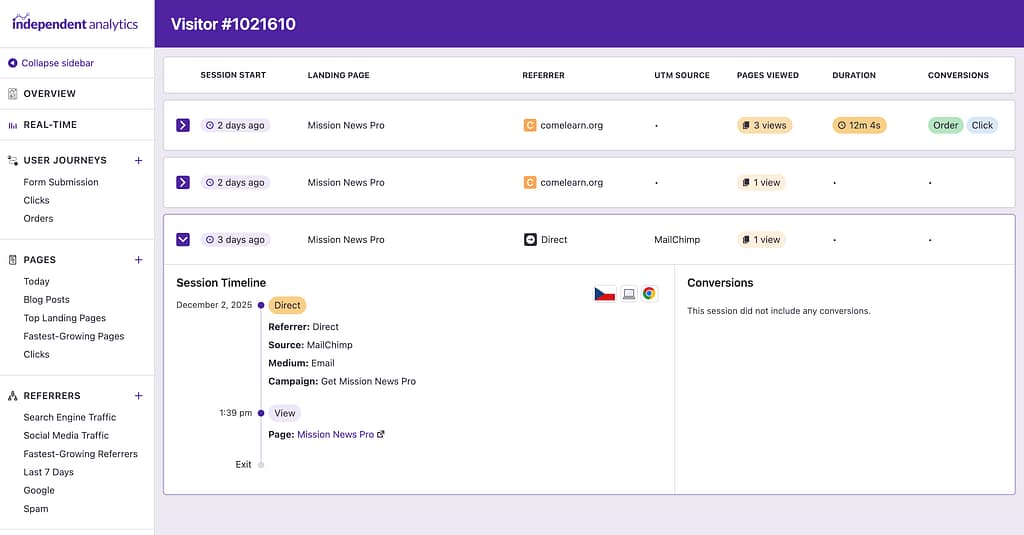
This can be helpful to understand the actions a user took leading up to a conversion event. For instance, in the example above, you can see a visitor who first reached the site via a MailChimp email, and then purchased a product the following day.
It is not possible to look up sessions based on an individual user’s name, email, or other personal data. The data recorded by Independent Analytics Pro is fully anonymized and does not include personal data.
Using filters is essential
While it can be valuable (and fun) to visit this report each day and look through a few journeys, you’re unlikely to look at them all. In fact, you might look at fewer than 1 in every 1,000 sessions that get recorded.
This is why it’s so important to utilize the filters.
With filters, you can quickly find sessions that match certain criteria. For instance, you can find sessions with a specific landing page, more than 1 page view, or those from a particular country.
Here’s a look at all the available filters:
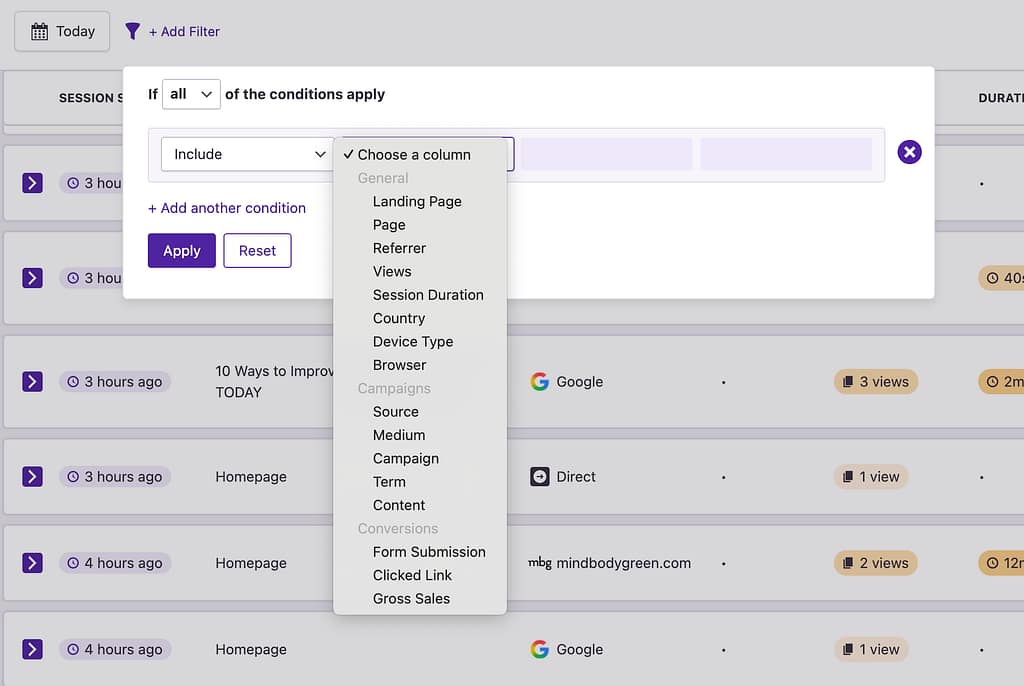
The Landing Page filter will find sessions with a matching landing page, whereas the Page filter will find sessions where the matching page was viewed at any point during the session.
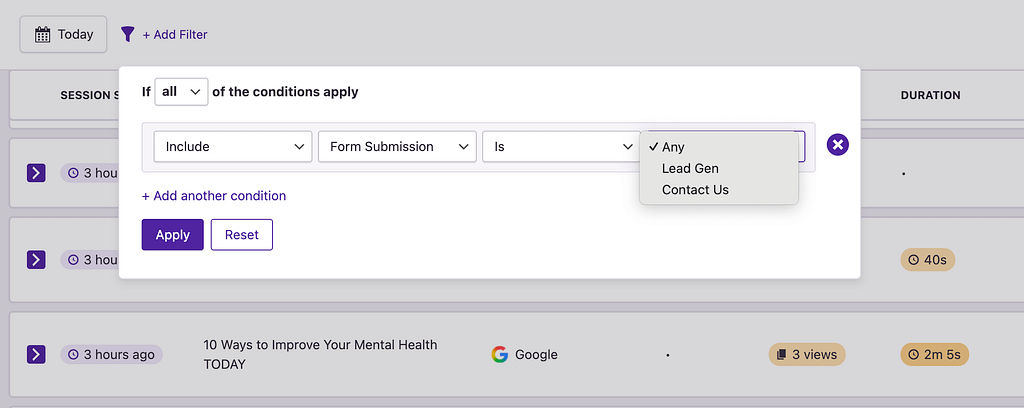
The Conversion filters are especially useful and a bit more advanced than the other ones.
For example, if you select the Form Submissions filter, you can choose to display sessions with any form submission, or only include sessions with a submission for a specific form.
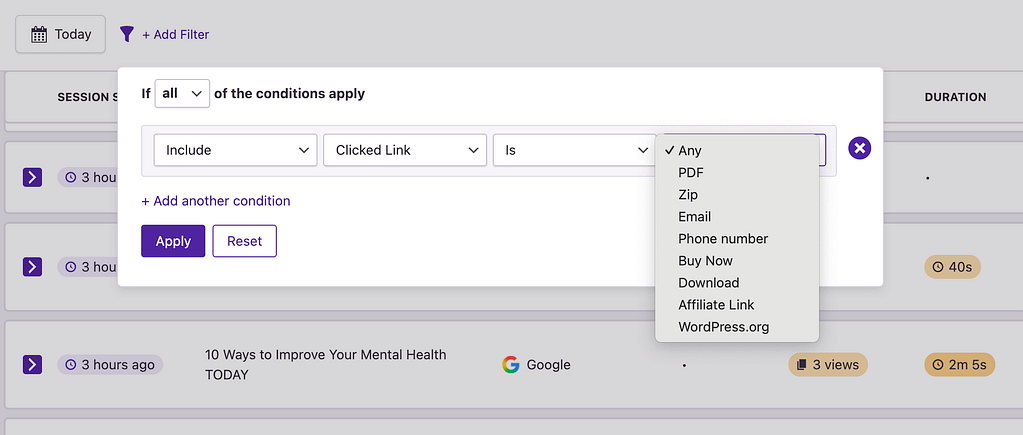
The Clicked Link filter works the same way, in that you can filter by any clicks or clicks that match a specific link pattern.
To find eCommerce orders, you can use the Gross sales filter, which works a bit differently from the other ones. With this filter, you can simply search for sessions with gross sales greater than zero, and that will eliminate any sessions without an order.
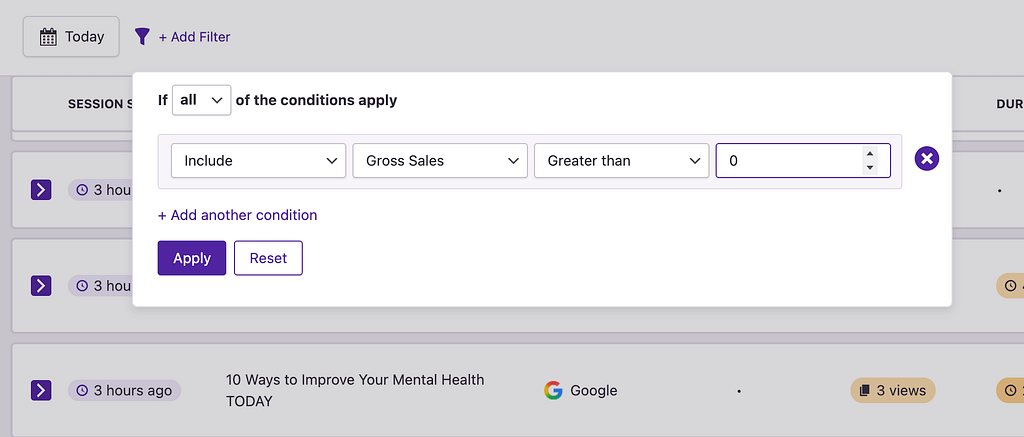
You have the flexibility to increase the value beyond zero if you only want to see sales with a certain value.
And like other reports, you can add multiple conditions. You could search for things like sessions with more than one view AND from Canada, or sessions with a form submission OR a click.
If you find a filter combination that’s valuable for your business, remember to save a new report, so you can revisit it easily in the future.
Lastly, the User Journeys report can display data from any date range, so you aren’t limited to only the most recent sessions. You can change the date using the date picker, just like any other report.
That’s everything you need to know to analyze your visitors and their behavior with the User Journeys report!
