This feature is only available in the Pro version of Independent Analytics.
Solo Reports allow you to view a full report for any table item in any report.
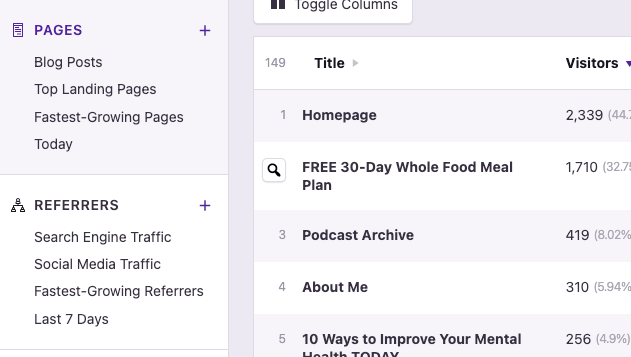
To open a Solo Report, hover over any row in the data table, and you’ll see a magnifying glass icon. Click on this button to open the Solo Report.
The Solo Report will open in a window above the current page, like this:
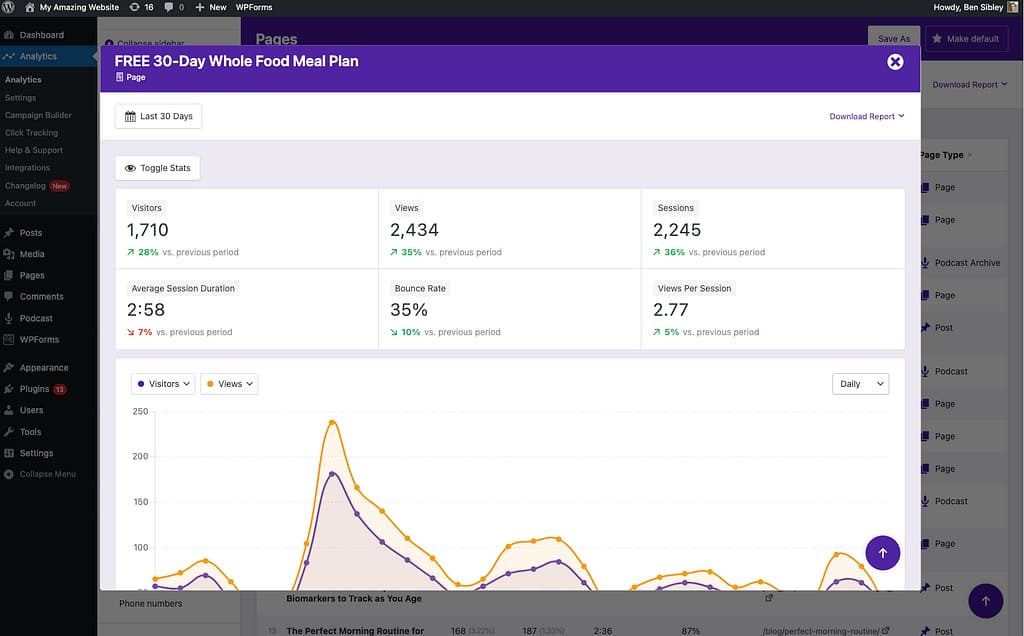
At the top, you’ll find the title and a label matching the report type, along with a button to close the report. You can also change the date range and download a PDF or CSV report.
The Quick Stats are identical to other reports, and include the same options to toggle their visibility. Likewise, the chart has the same settings for changing the visible stats and the interval.
Lower in the report, you’ll find a data table for each of the other report types.
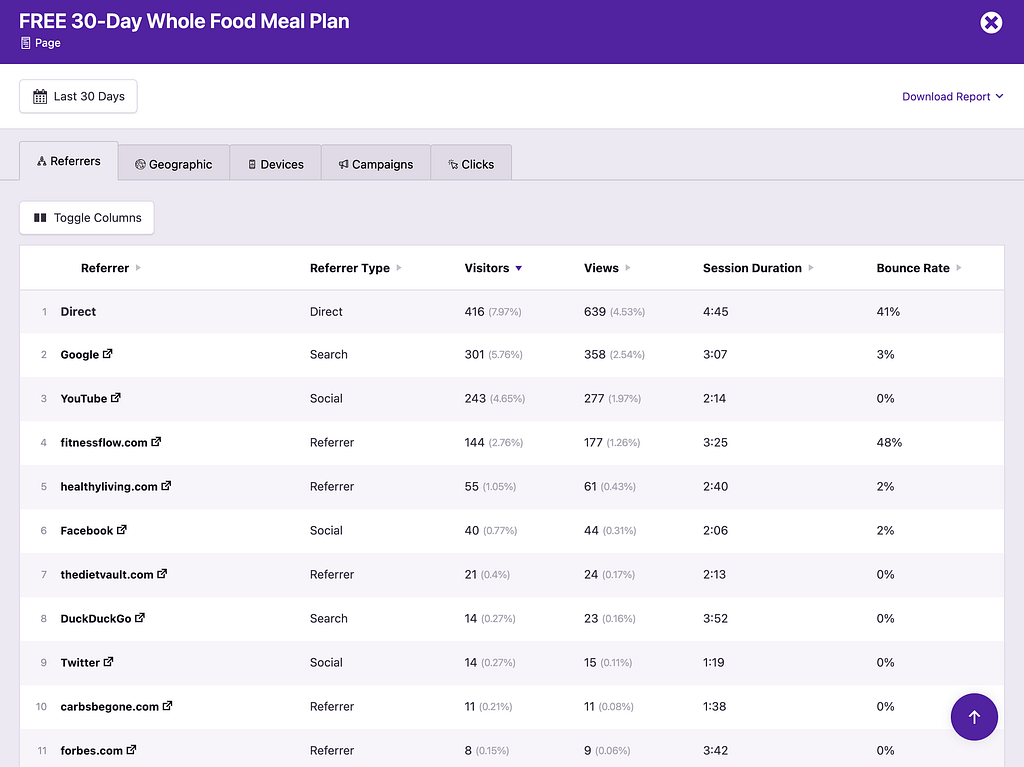
In this example, we’re viewing a Solo Report for a page, so you can see tables for all the other report types. In the Referrers table, this lets you see where visitors of this page came from.
As another example, if you click on the Geographic tab, it will reveal the countries that visitors of this page visited from.

Like in other reports, you can toggle the visible columns in the table and change the grouping, such as switching from Countries to Cities.
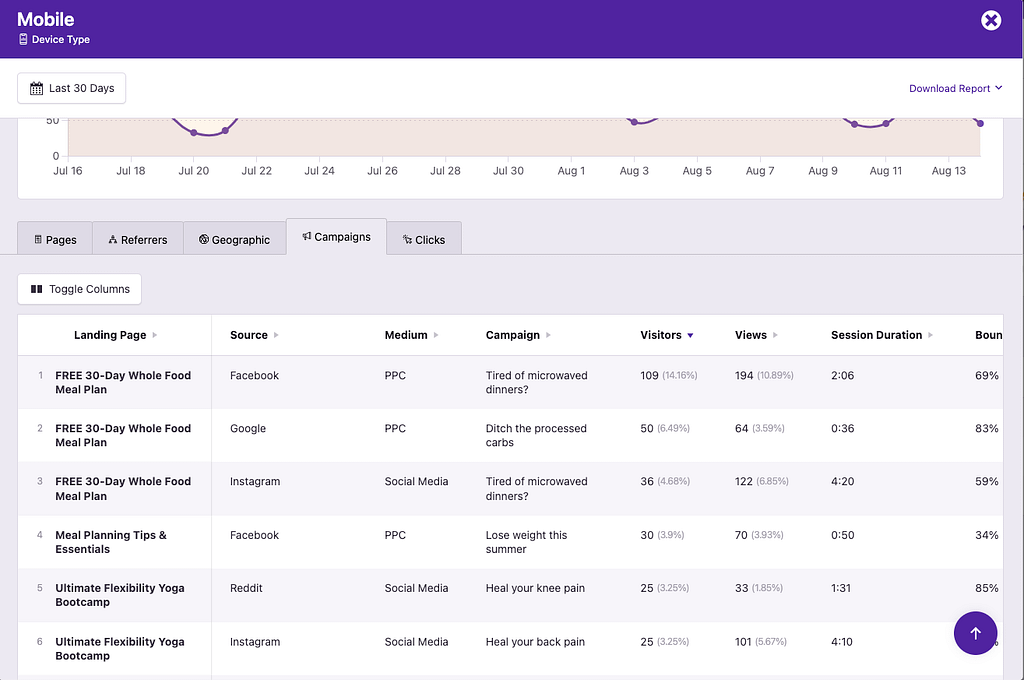
Solo Reports are available for table items in all reports, so this functionality isn’t restricted to just pages. For example, you could open a Solo Report for mobile devices and then check your campaign traffic from these visitors.
In conclusion, Solo Reports are perfect when you want to learn more about a particular page, referrer, location, device, campaign, or link. They allow you to see stats for this one item and segmented data from the other reports.
Have fun exploring your data!
