This feature is only available in the Pro version of Independent Analytics.
Below you will find a description of each module and how to use it in your own Overview report.
Top 10 Lists
The Top 10 List module will display a list of up to 10 results sorted by the selected metric.
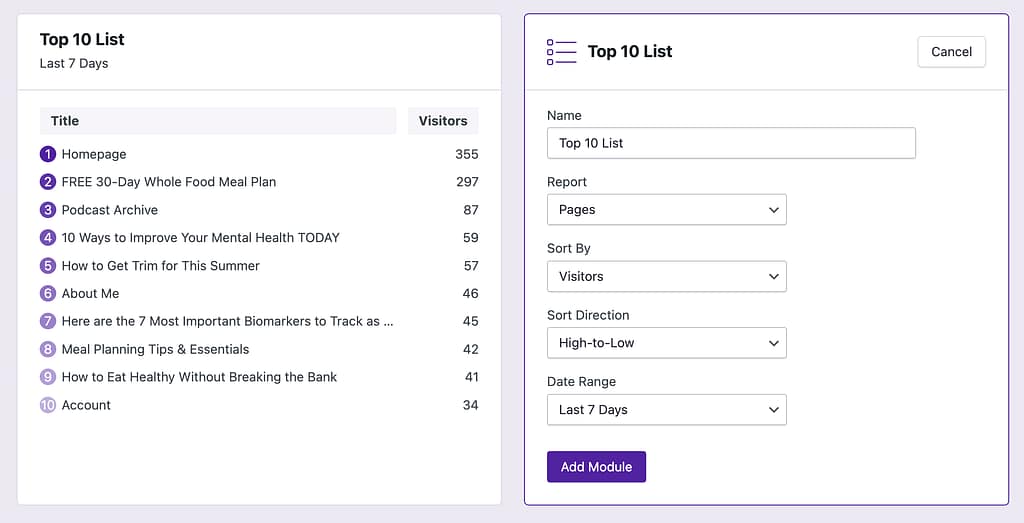
This module is useful for finding your best- or worst-performing pages, referrers, geolocations, devices, and campaigns.
Quick Stats
The Quick Stats module is just like the Quick Stats display at the top of your standard reports and displays aggregated metrics over the given date range.
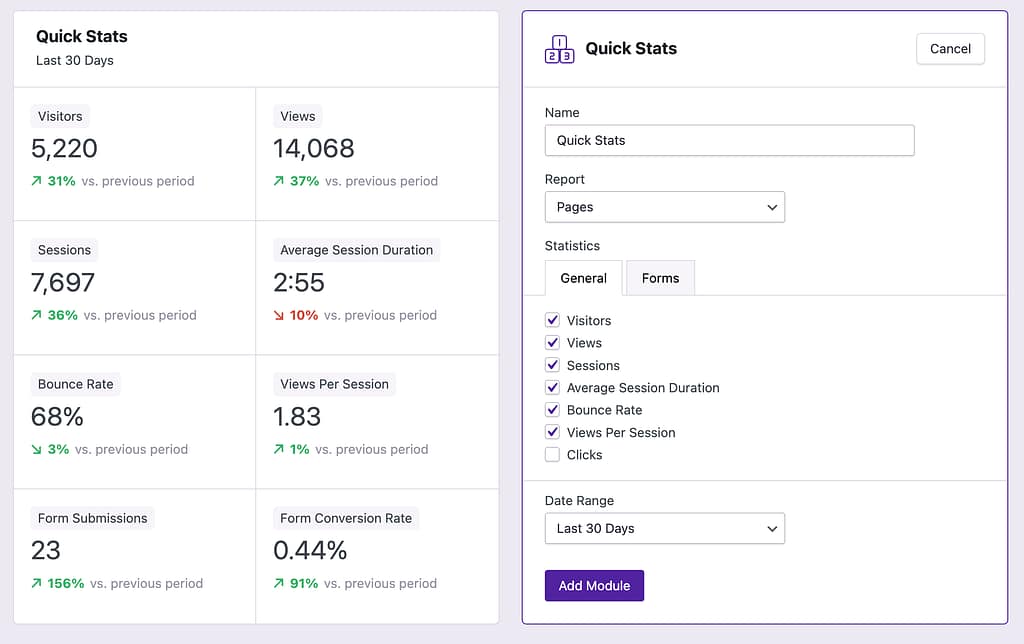
You can choose any report you want here, so you could choose to display stats for a specific segment of your traffic, like search engine visitors only. Also, don’t forget you can display form and eCommerce metrics here too.
Line Chart
The line chart can show you the performance of any metric over time.
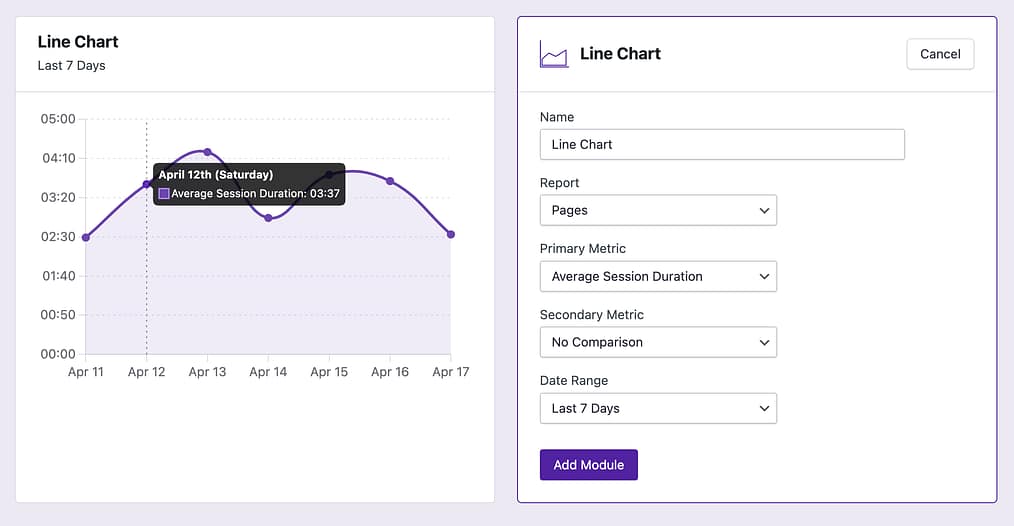
You can choose any report for this module, so you could show more granular data, like the bounce rate for your blog posts. You can display one or two different metrics in the chart.
Pie Chart
The Pie Chart module is perfect for comparing top performers (or underperformers).
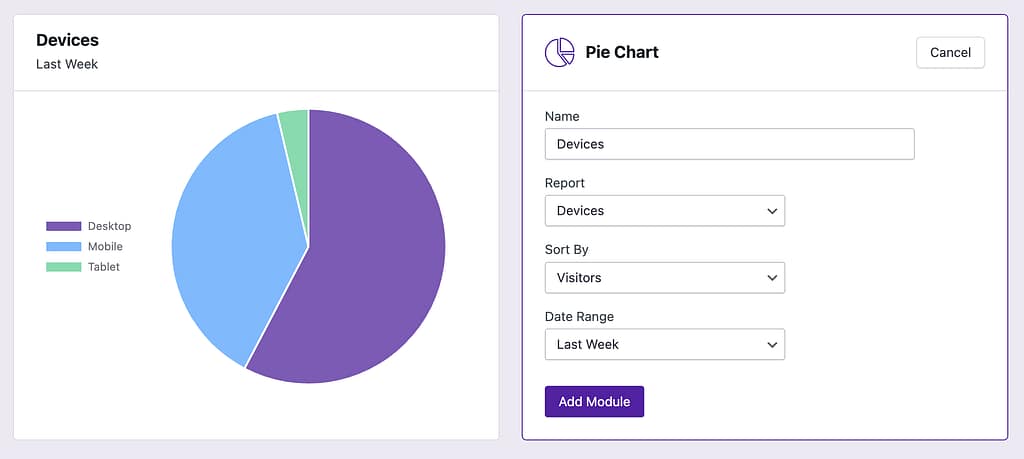
Since you can choose any report, you could also display your top traffic sources or countries in a pie chart. You can use any metric as well, so you could also display pages with the most clicks or cities with the lowest bounce rate.
World Map
The World Map module is just like the map found in the Geographic report. Countries are color coded based on their relative traffic, and you can hover over any country to see its views, visitors, and sessions.
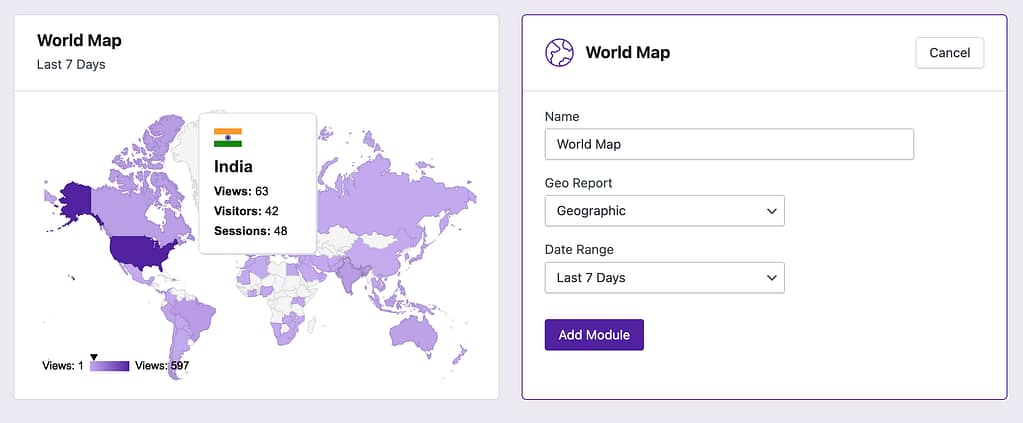
You can display data from any of your Geographic reports instead of showing stats for all countries.
Recent Views
The Recent Views module is like a log displaying your site’s 40 most recent page views. Each view includes the timestamp and the visitor’s country, device, and browser, in addition to the page viewed.
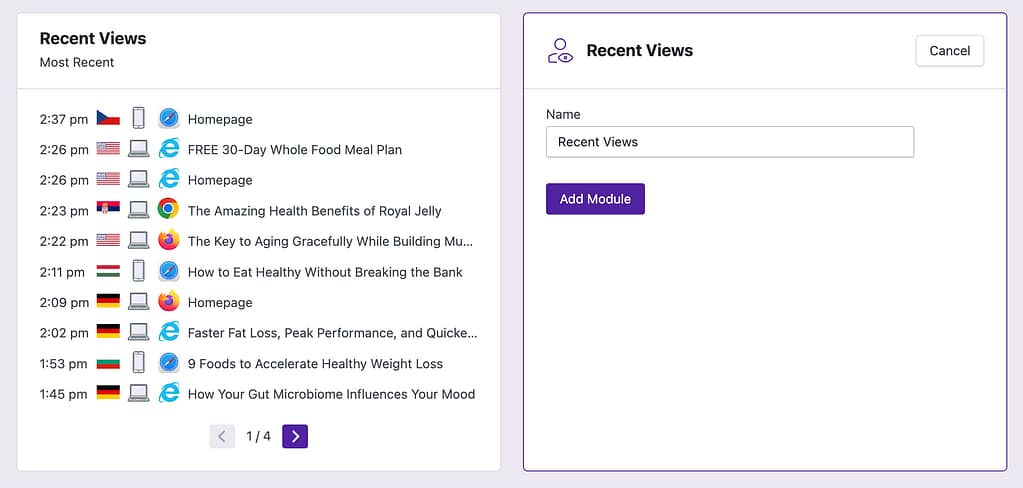
This module doesn’t have any settings to configure. You can use the arrow buttons at the bottom to navigate between pages. It displays up to 20 views at a time if expanded to the wider width.
Recent Conversions
The Recent Conversions module is like a log that shows your site’s 40 most recent conversions. Each conversion also includes the timestamp and the visitor’s country, device type, and browser.
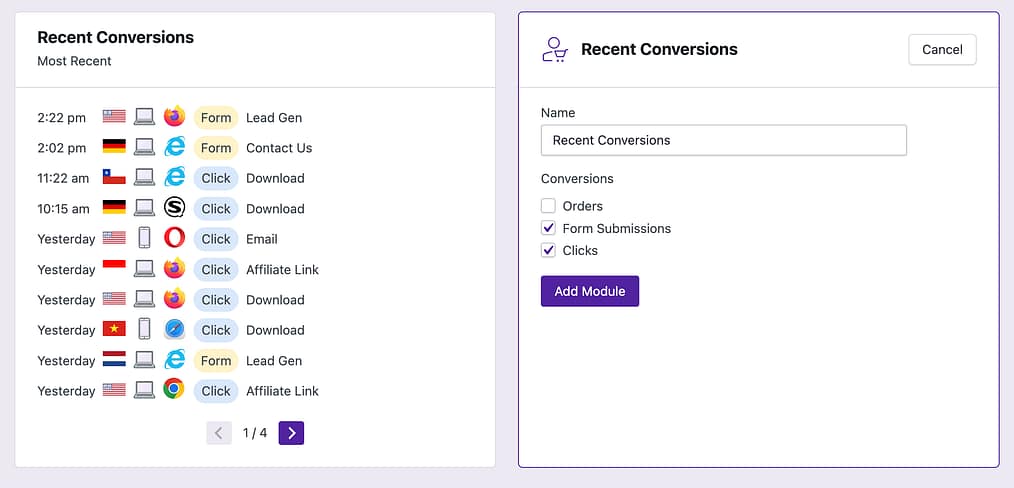
You can display eCommerce orders, form submissions, and/or clicks in this module. You can create multiple copies of this module if you’d like to dedicate each one to a specific conversion type.
Busiest Time of Day
The Busiest Time of Day module shows you which hours your site gets the most and least traffic.
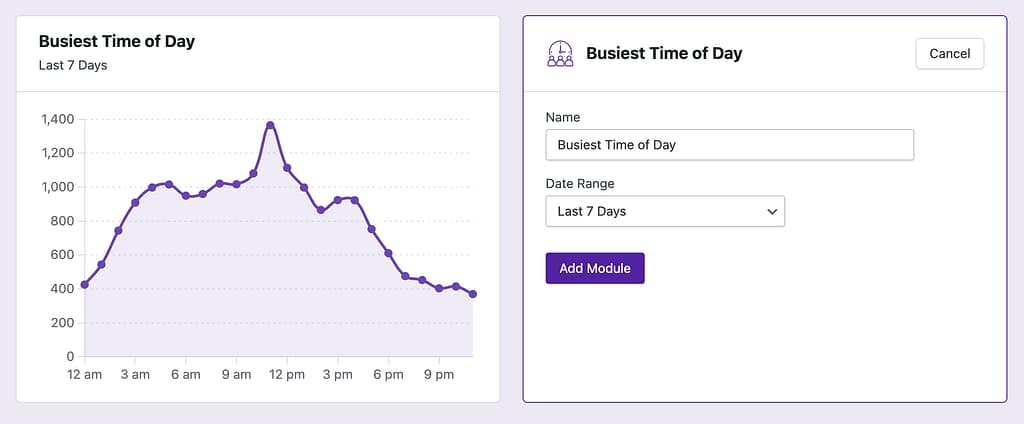
The date range for this module is the sample size used to get the average. For example, you can see the hours your site was the busiest over the last 7, 30, or 90 days.
Busiest Day of Week
The Busiest Day of Week module shows you which days your site gets the most and least traffic.
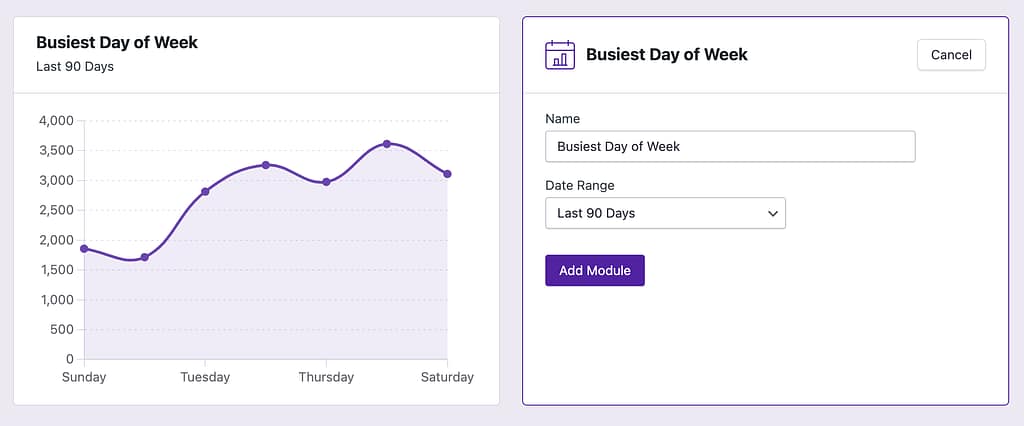
The date range is the sample size you want to use when getting an average number of sessions per day. You can choose the starting day of the week in the Analytics > Settings menu.
New vs. Returning Sessions
The New vs. Returning Sessions module shows you how often visitors return to your website.
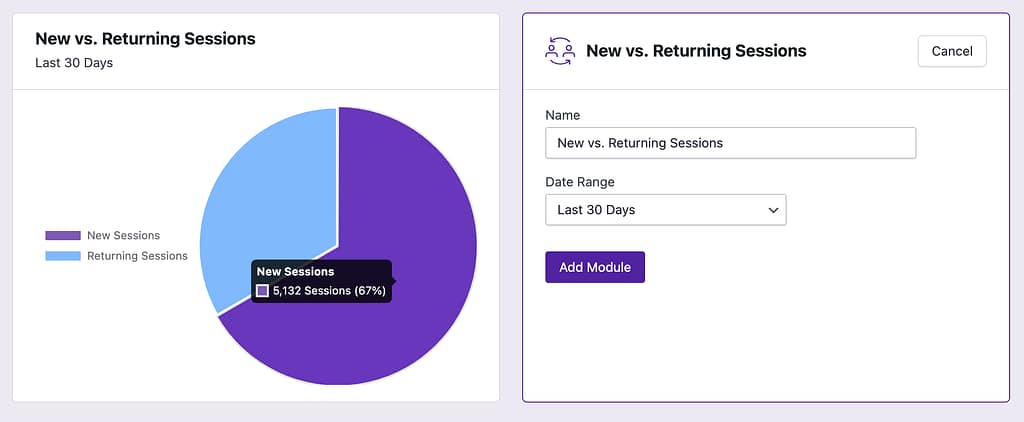
If someone arrives on your site for the first time, this is counted as a new session. If they have been to your site before, then it is counted as a returning session. This calculation makes it easy to see how much of your traffic is from returning visitors. You can read more about this metric here if you’d like.
