
You can see where your WooCommerce customers come from by using an analytics plugin that ties order data to traffic sources.
Independent Analytics Pro shows you which referrers, search queries, and campaigns generate actual revenue, not just visits, so you can focus your marketing on what’s driving sales.
Which Marketing Channel Is Driving the Most WooCommerce Sales?
WooCommerce can show you the traffic source of a sale when you view the Orders menu, but this data is limited and requires you to review one order at a time.
Independent Analytics Pro tracks sales automatically via its WooCommerce integration, and allows you to see every traffic source for every sale on an individual and aggregated basis.
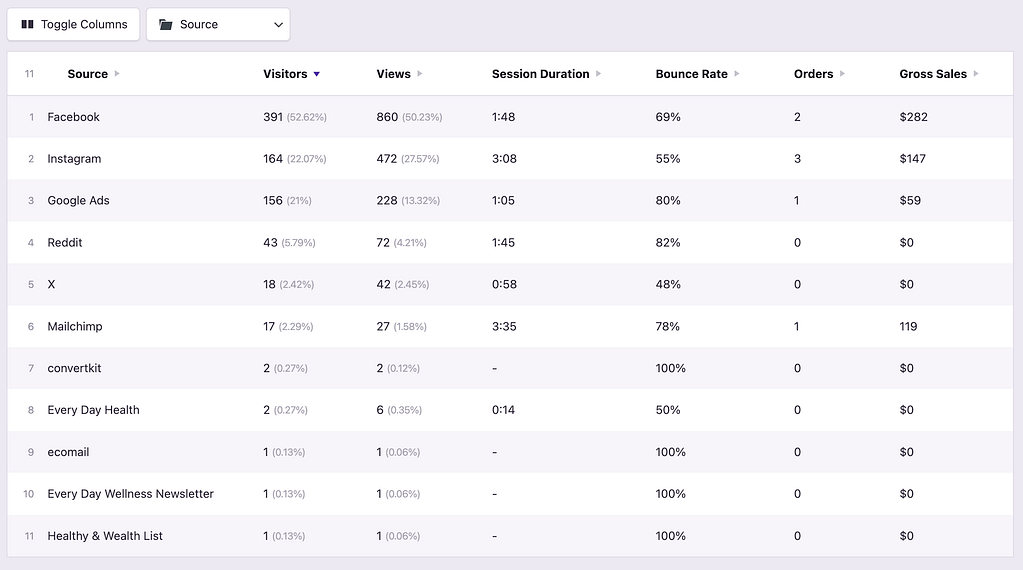
For instance, you can view the Referrers report and see how many sales you received from each traffic source.

With WooCommerce alone, you’d have to tabulate this data yourself. Instead, you can view one report and easily compare stats between your referrers.
You can do the same analysis in the Pages report to find your most profitable WooCommerce landing pages.
Even better, you can group your referrers by their type, so you can compare sales from search engines versus social media sites and other referrers.
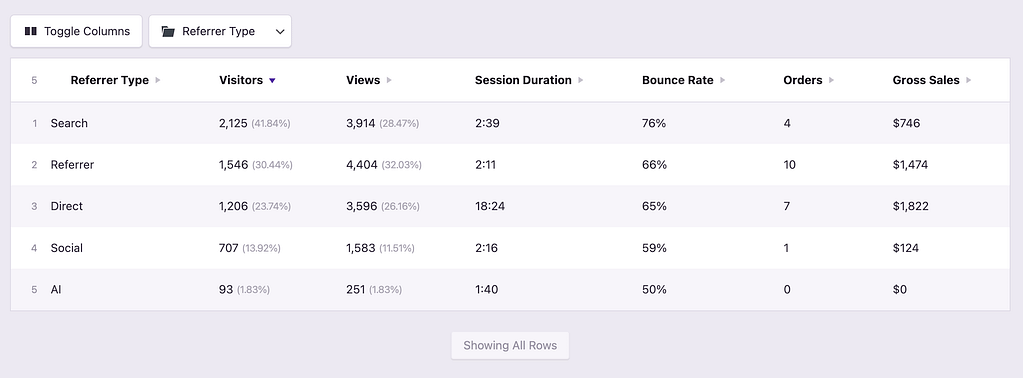
This is the perfect way to find out which marketing channels are driving the WooCommerce sales. Even better, it lets you track your WooCommerce orders without Google Analytics.
How to Track UTM Parameters for WooCommerce Orders
WooCommerce shows you the campaign’s utm_source value when viewing individual orders. This reporting is helpful, but shallow.
Independent Analytics Pro shows campaign data when viewing an order via its Customer Journey metabox and also shows aggregated stats in the Campaigns report.
The Campaigns report shows you all the traffic that reached your site via campaign links. That is to say, any links created with UTM parameters. This way, you can see the total number of orders and gross sales from each campaign instead of viewing your orders one at a time.
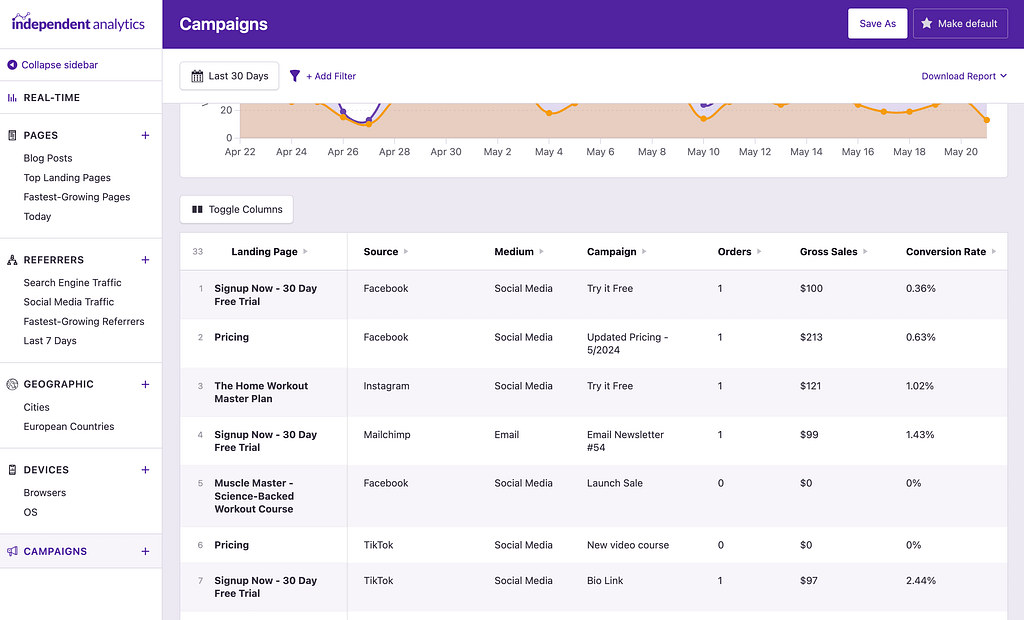
By default, each unique campaign is listed, so you can see sales from each campaign, even when there is only a difference in the Term or Content parameter.
You can also collapse the campaigns into new groups. For instance, if you want to see the orders from a specific source like Facebook and don’t care about the individual campaign, you can do so easily.
This gives you a lot of flexibility for analyzing the performance of your UTM campaigns and their impact on your WooCommerce sales.
How Can I See the Customer’s Full Journey Before the Sale?
Knowing a customer came from Google is useful. Knowing they visited three times over two weeks before buying tells you something more valuable about how your customers actually make decisions.
Independent Analytics Pro makes this data readily available via its User Journeys report. It shows you the visitor’s full journey through your website, and you can find their previous journeys as well, to create a full picture.
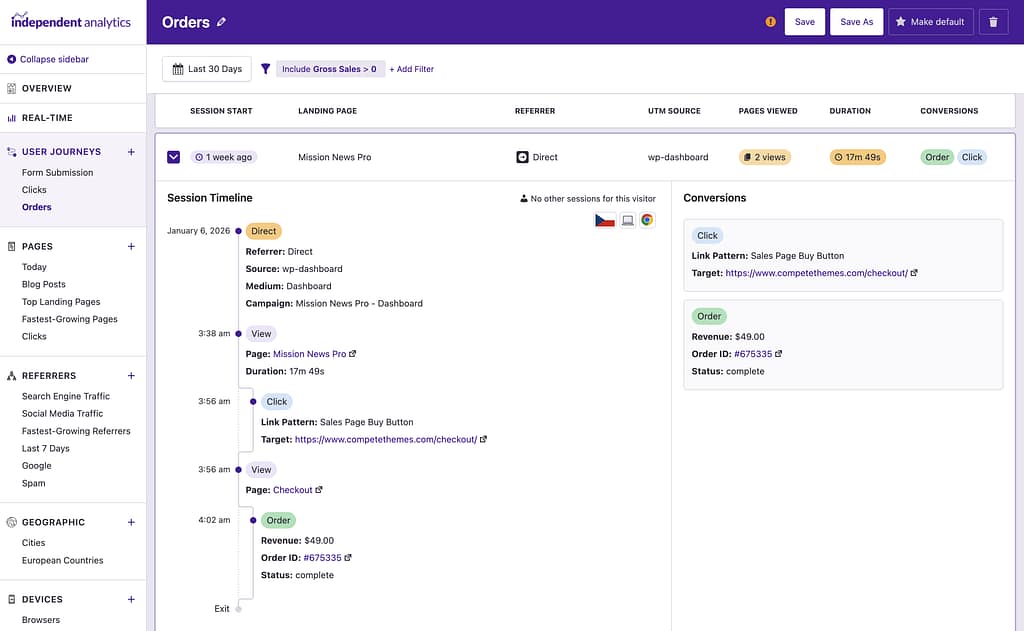
Browsing this data is totally different than looking at aggregated data, or simply viewing the source for a sale. You get a real feel for what the customer did on your website and what their experience was like.
How Do I Find Traffic Sources with the Highest Average Order Value?
Independent Analytics Pro lets you compare traffic sources by total revenue and average order value side by side.
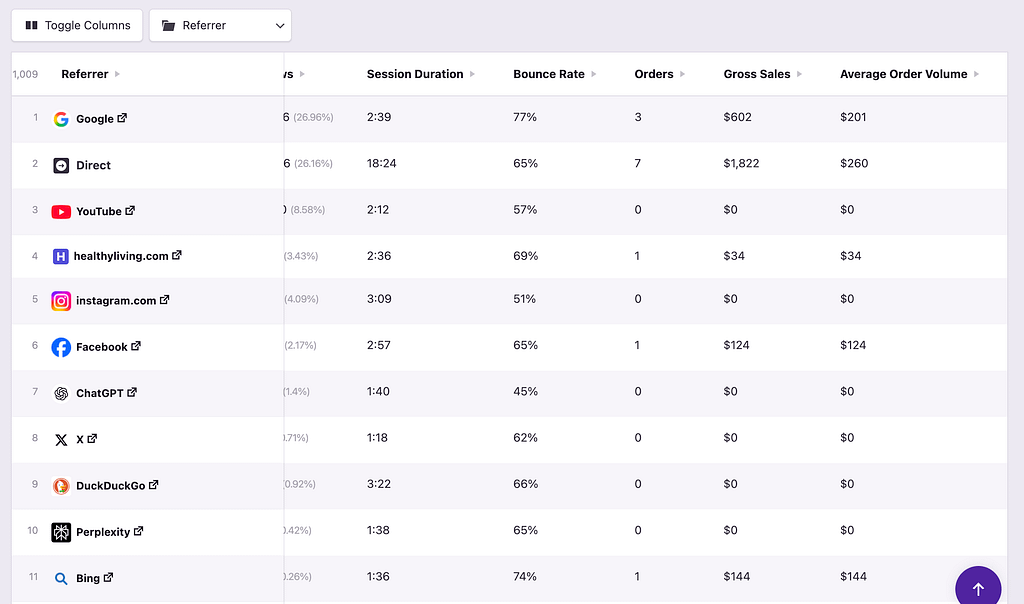
This often surfaces surprises. Email lists and niche referral sites frequently punch well above their weight in revenue per visitor, while high-volume sources like social media can look strong on traffic but weak on actual sales.
Evaluating the order size from each site also gives you a hint at what people in that channel prefer to buy. For instance, if you’re advertising a cheaper product on Reddit, but it turns out they tend to buy higher-priced items, then you should update your advertising strategy to match the market.
How Can I Compare Conversion Rates Between Traffic Sources?
Conversion rate is another metric that you can display in any report created by Independent Analytics Pro. All you have to do is enable this column in the data table, and then you can compare conversion rates between any referrers.
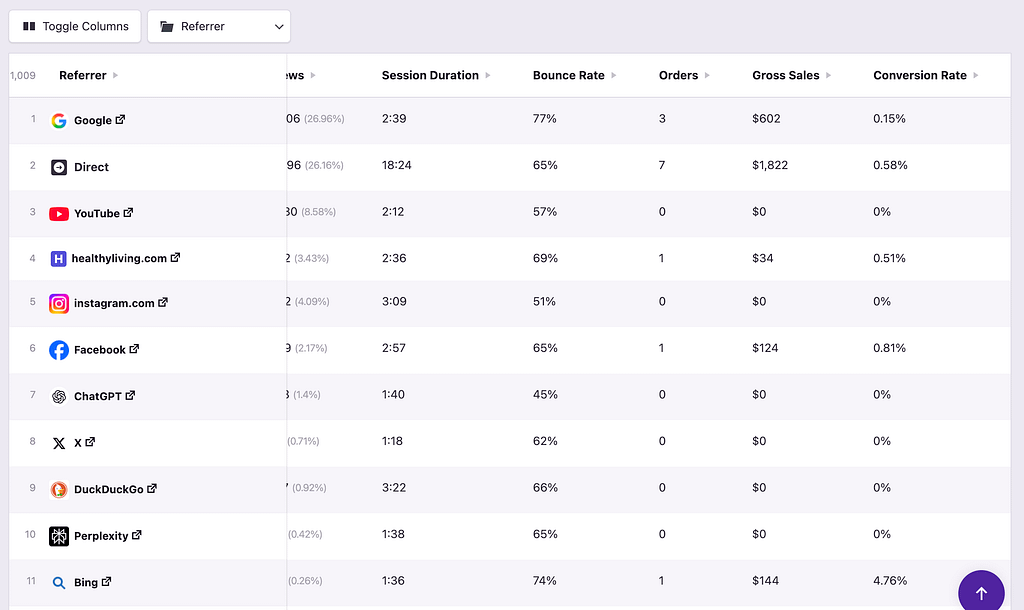
This is one of the best ways to evaluate your marketing channels. For instance, you might find one referrer driving a small number of sales but converting at a much higher-than-average rate. This would be an excellent site to spend more time marketing on.
If you want to make this analysis simple for yourself, you can also add a Pie Chart module to the Overview report to keep an eye on conversion rates between your marketing channels.
Finding where your WooCommerce customers came from is easy to do with the right tools, like the Independent Analytics Pro plugin. It allows you to compare sales, order volume, and conversion rates between individual referrers and marketing channels.
And it does it automatically without any configuration required, thanks to the internal integration with WooCommerce.
