
This feature is only available in the Pro version of Independent Analytics.
We are working on a new video recording to match the updated design. It will be published shortly!
The Real-time dashboard in Independent Analytics shows you how many people are on your site right now, what pages they’re viewing, and where they came from.
What data is included?
At the top of the report, you’ll see a count of your site’s Active Visitors, which is the number of people who have viewed at least one page in the last five minutes.
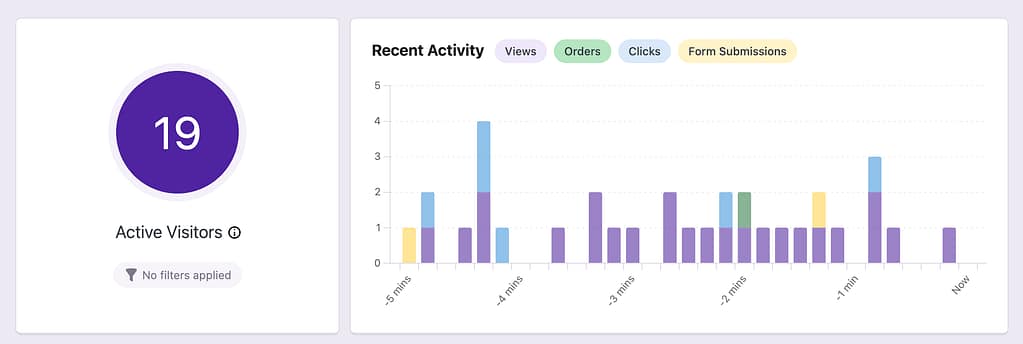
There’s also a chart that shows your recent views, orders, clicks, and form submissions. You can click on any of the labels to hide the corresponding bars in the chart.
Below the Active Visitors count and chart, you’ll find six lists. There is one for each of the basic reports, plus a world map at the bottom.

Each list is sorted by the number of visitors. For instance, the Pages list in the screenshot above tells you that 4 visitors are looking at the Homepage. Likewise, 3 visitors came from Google, 11 are using Desktop devices, and 2 of them reached your site via campaign links.
At the top of each list (besides Pages), there is an option to change the grouping. For example, the Geographic list at the bottom shows countries by default, but can be changed to show cities instead.
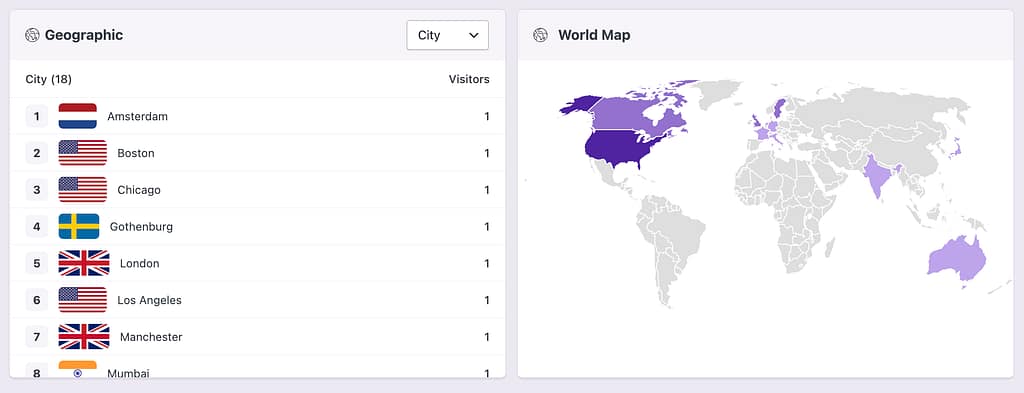
This data gives you an overview of what’s happening on your site, but you can dive even deeper with filters.
The grouping you select will stay selected even when you refresh the report. This is so that local businesses can always keep the Geographic list showing cities, since country-level data is never useful for them.
How to filter the real-time report
If you hover over any list item in the real-time report, you’ll see it gets highlighted and shows a filter icon.

Clicking on that item will apply a filter so that the report only shows data for visitors who viewed that page. This way, you can see the referrers, devices, campaigns, and geolocations of visitors who viewed that page.
This works for every list, so you could also click on a referrer to see which pages those visitors looked at.

This is a fun way to explore your data and learn more about the visitors on your site. But it does create one issue…
How to pause the report
When you are changing the list grouping and filtering the report, you may get annoyed by the data refreshes that take place every 10 seconds. Sometimes, you don’t want the latest data; you want to freeze time so you can analyze the data you’re currently looking at.
To do this, you can click on the pause button at the top of the report.
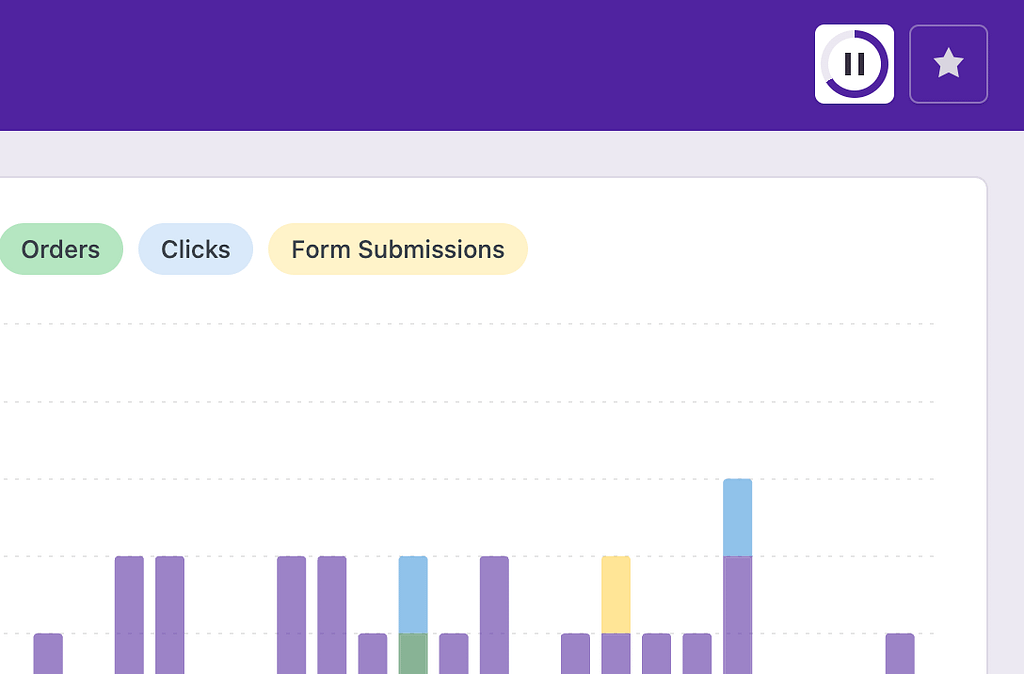
Clicking this button will freeze the report until you either click the unpause button or reload the page. The real-time report will then fetch the latest data and resume refreshing the data every 10 seconds.
For help with Pro features or pre-sale questions, please reach out via our contact page.
